Blog
Dispelling some myths about the gap between test-lab and real-world vehicle CO2 emissions
We’ve just released the annual update to our From Laboratory to Road series, which documents the growing gap between official, or type-approval, CO2 emissions from passenger cars in Europe and their actual emissions (and fuel consumption) on the road, during everyday driving. The 2015 update shows that, on average, the gap increased from 8 percent in 2001 to an astonishing 40 percent in 2014 (see Chart 1).
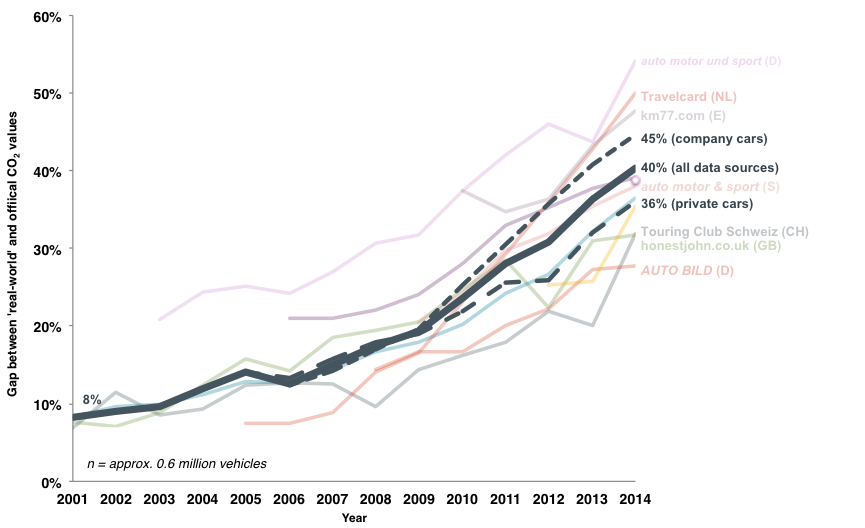
Chart 1. Gap between real-world and official CO2 emission values for various real-world data sources, including average estimates for private cars, company cars, and all data sources.
While the increase in the gap has been documented in previous From Laboratory to Road reports, there is some confusion about the reasons for the shift. Three myths that particularly need to be dispelled:
Myth #1. “Drivers are to blame for the gap between real-world and official CO2 values.”
It isn’t easy to define real-world driving. You will probably experience vastly different fuel consumption values when you are commuting to work on congested city streets than you did during your last holiday trip on scenic country roads. Nevertheless, when we look at large data sets (and the 2015 Lab to Road update analyzes data on about 600,000 vehicles), we can see overarching trends. While everyone uses their cars differently, the vast majority of vehicles cluster around a central estimate. This central estimate is shifting further away from the official CO2 values each year.
Typical driver behavior may indeed differ from the driving cycle used to determine official fuel consumption values, explaining the existence of a gap. However, the growth of the gap cannot be explained based on driver behavior.
This year, we took a closer look at spritmonitor.de data for different driving styles, including economical, balanced, and speedy driving. While driving style certainly makes a difference in CO2 emissions and fuel consumption, the gap has consistently increased for all driving styles (see Chart 2). The Spritmonitor.de data also indicates that driver behavior, for example the number of vehicles driven in a fuel-conserving manner, has remained relatively constant since 2001. So there’s no reason to suspect that driver behavior is the cause of the growing gap. But when we look at individual vehicle models, we observe abrupt increases in the gap after major technical overhauls (see this blog post for details). These jumps in the gap after model facelifts indicate that the vehicle, not the driver, are to blame for the increase.
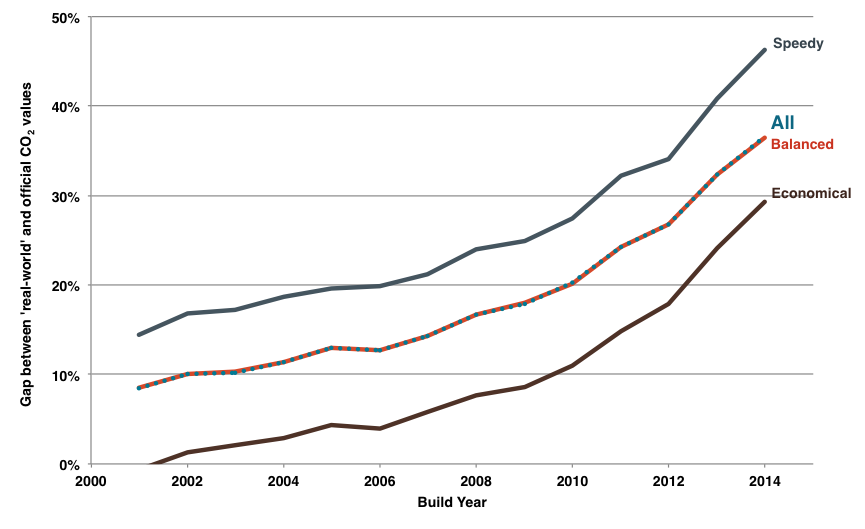
Chart 2. Gap between real-world and official CO2 emission values for different driving styles, including economical, balanced, and speedy driving (based on Spritmonitor.de).
Myth #2. “The gap is the result of ever decreasing official CO2 and fuel consumption values.”
The gap is calculated as the ratio of real-world fuel consumption values to official fuel consumption values, less one. The argument is that since the official fuel consumption values are in the denominator and are decreasing over time, the gap will automatically increase.
A simple calculation illustrates that this effect alone cannot account for the observed increase. In 2001, the gap was around 8 percent, and European cars on average emitted 170 g CO2/km according to official CO2 emission figures. That is, the gap was equivalent to roughly 14 g/km in absolute terms. If the gap had remained around 14 g/km, then in 2014, when the official average was 123 g/km, the gap would be about 11 percent. In reality, our data points to a gap of approximately 40 percent, or roughly 49 g/km, in 2014. In short, the decreasing denominator is certainly not enough to explain the increasing gap.
Myth #3. “Consumers know that the official values are to be taken with a grain of salt. The testing process is needed to produce repeatable and comparable CO2 emission values — they do not have to be representative of real-world driving.”
The type-approval process can indeed not be expected to produce representative results for every type of driver. There is also anecdotal evidence indicating that car buyers are skeptical of manufacturers’ fuel consumption claims. Nevertheless, the official CO2 values are the basis for the 2020 target of 95 g/km for new passenger cars. Similarly, most member states have introduced vehicle taxation schemes that, at least in part, use the official CO2 values for the calculation of the tax. Since these values are growing increasingly unreal over time, policies that use CO2 figures are being undermined. In addition, since some manufacturers have a higher gap than others, the type-approval process isn’t even producing comparable results.
If these are misconceptions, what are the real reasons for the increasing gap between real-world and official CO2 values? In a joint study with Element Energy for the Committee on Climate Change, we found that vehicle manufacturers’ exploitation of “flexibilities” in the testing procedure is the leading cause for the increasing gap. The analysis also shows that the introduction of the Worldwide Harmonized Light Vehicles Test Procedure (WLTP), a new testing procedure that will be implemented in the EU in 2017, will bring some improvement, but it will not by itself solve the problem of unrealistic official CO2 values. Additional measures, such as in-use conformity testing, are needed. Such tests are already standard practice in the U.S. and could help close the gap between real-world and official CO2 values.