Charts and Visualizations
Much of the data we work with can be used in many different ways. Here, we showcase data in figures, interactive maps, and other data visualizations.
Filters
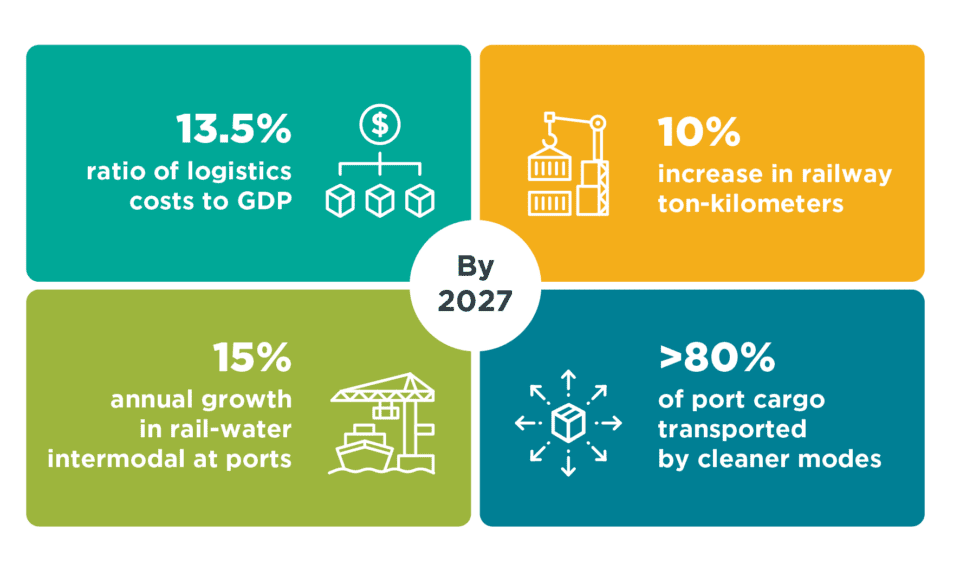
Action Plan targets for improving transportation and logistics in China
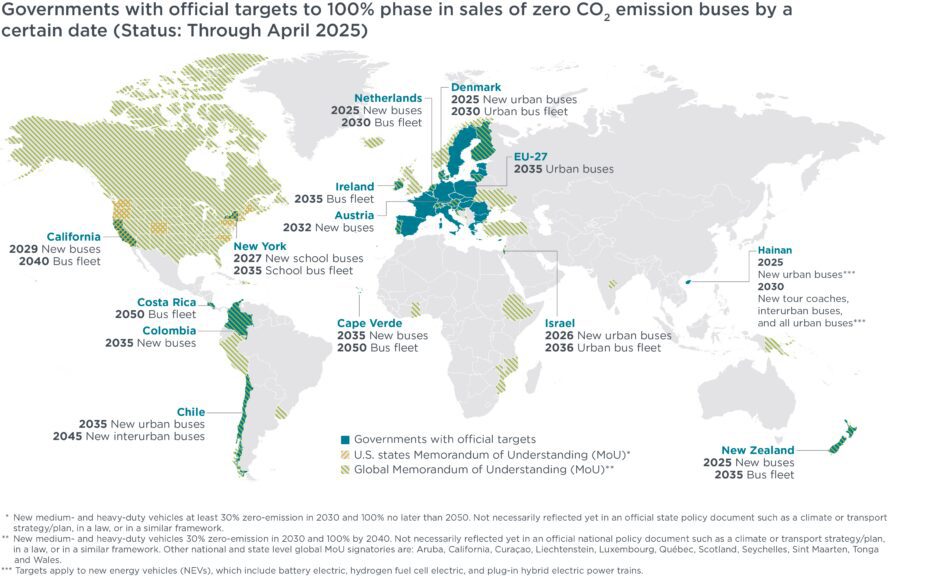
Zero-emission vehicle phase-ins: Medium- and heavy-duty buses (April 2025)
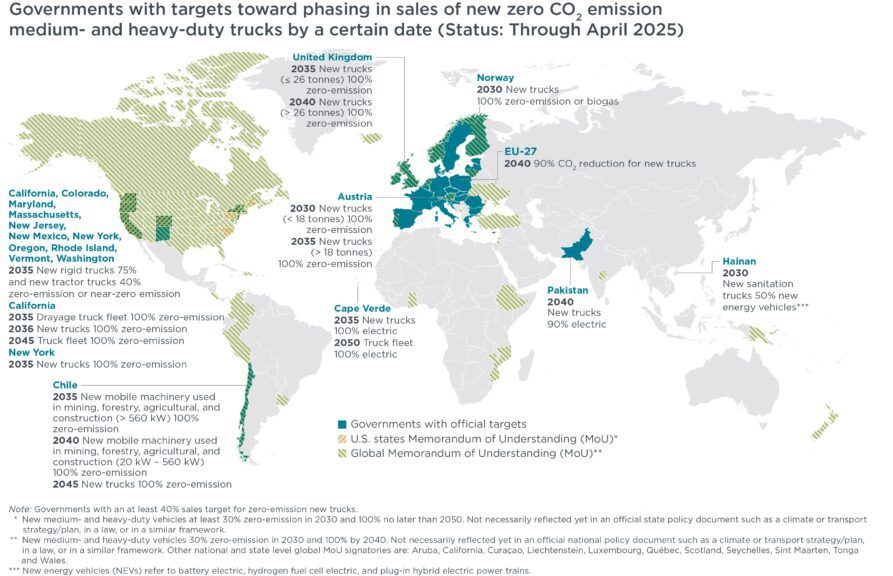
Zero-emission vehicle phase-ins: Medium- and heavy-duty trucks (April 2025)

U.S. sales of electric vehicles by automaker, excluding Tesla, 2011–2024
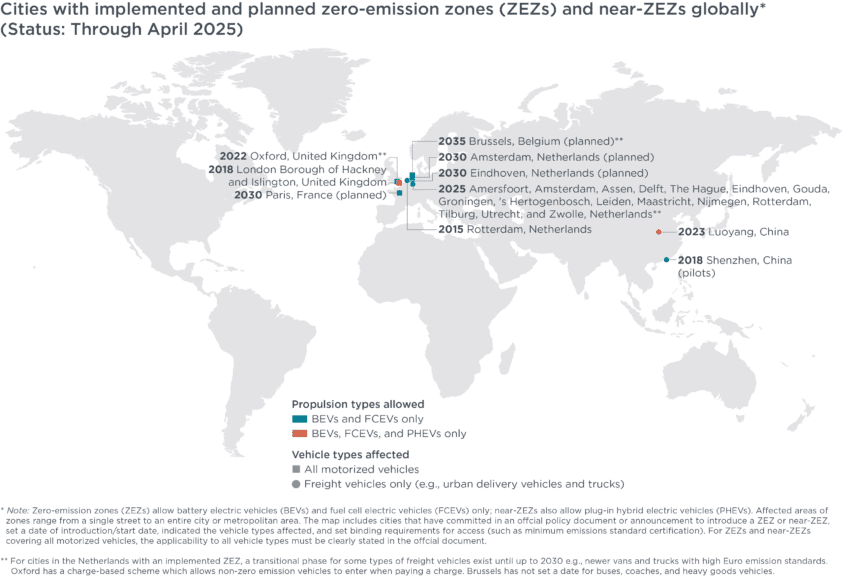
Zero-emission vehicle phase-ins: Zero-emission zones (April 2025)
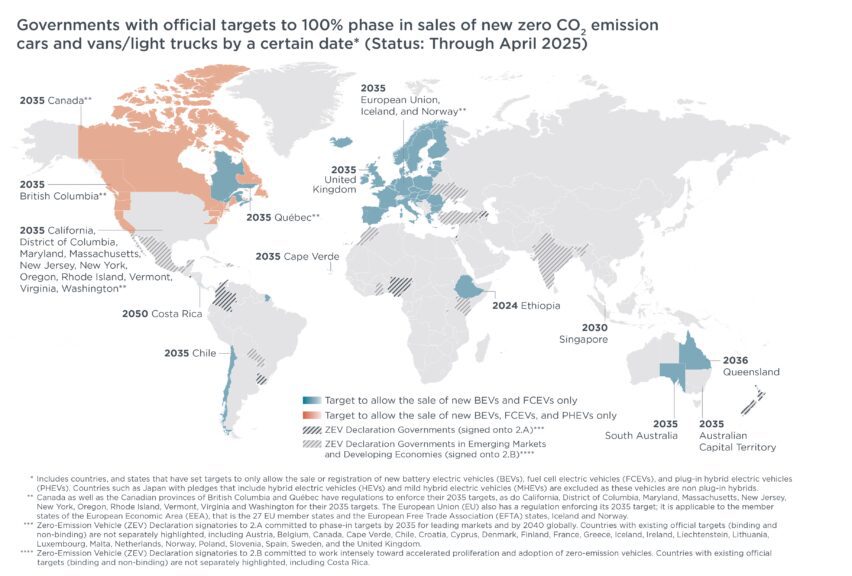
Zero-emission vehicle phase-ins: Passenger cars and vans/light trucks (April 2025)
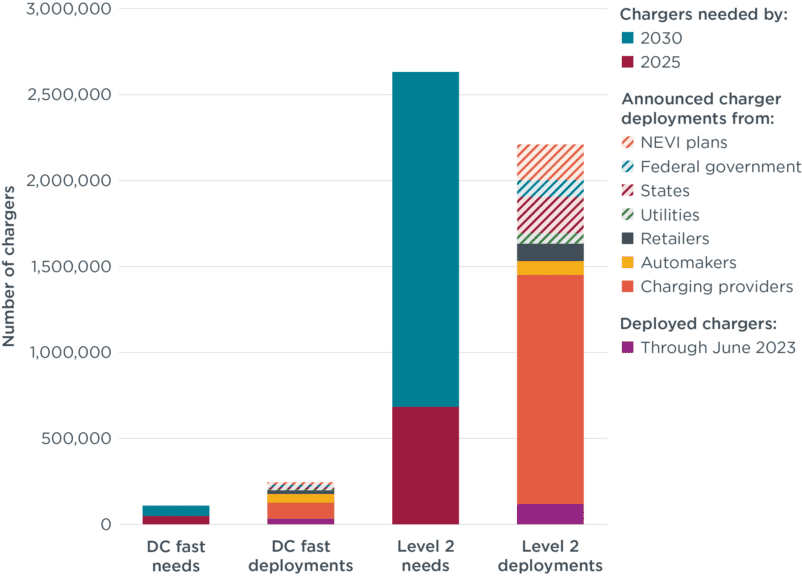
Non-home EV chargers needed by 2030 compared with announced deployments
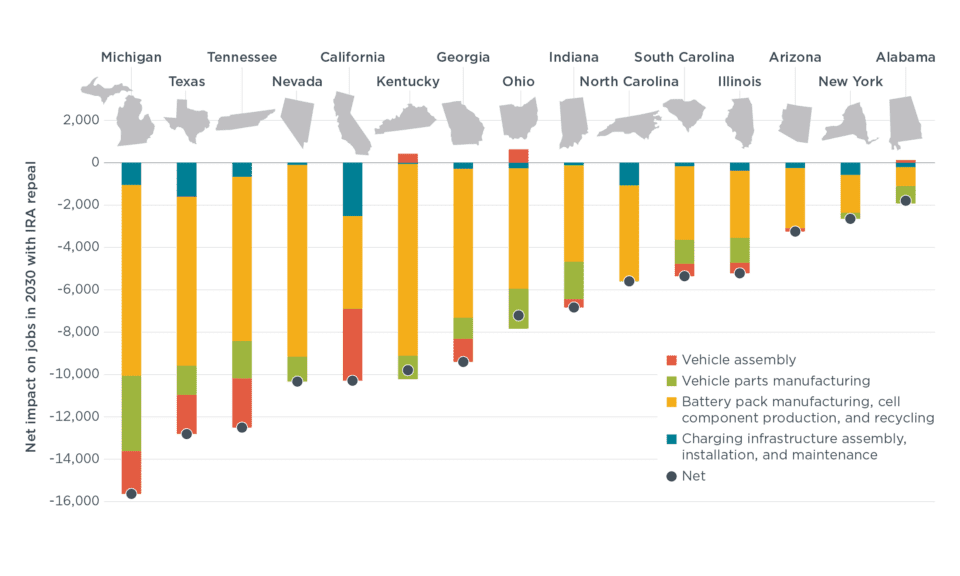
Net impact on jobs in 2030 with IRA repeal in the most impacted 15 states
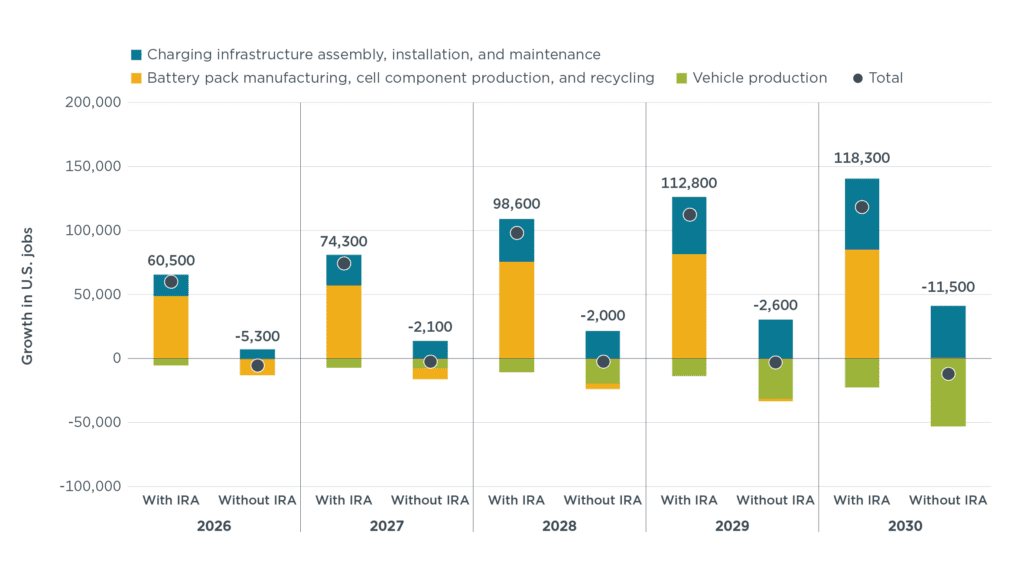
Projected growth in U.S. jobs compared with 2024 under the With IRA and Without IRA scenarios

Sales of zero-emission medium- and heavy-duty vehicles in China, 2014 to 2024