Visualization
Filters
U.S. sales of electric vehicles by automaker, excluding Tesla, 2011–2024
In 2024, non-Tesla EV sales grew by 20% compared with 2023, reaching about 960,000 and continuing a trend of automakers other than Tesla collectively gaining a larger share of the new EV market. However, as the top EV seller, Tesla’s 5% decrease in sales in 2024 slowed the growth rate of the overall EV market. […]

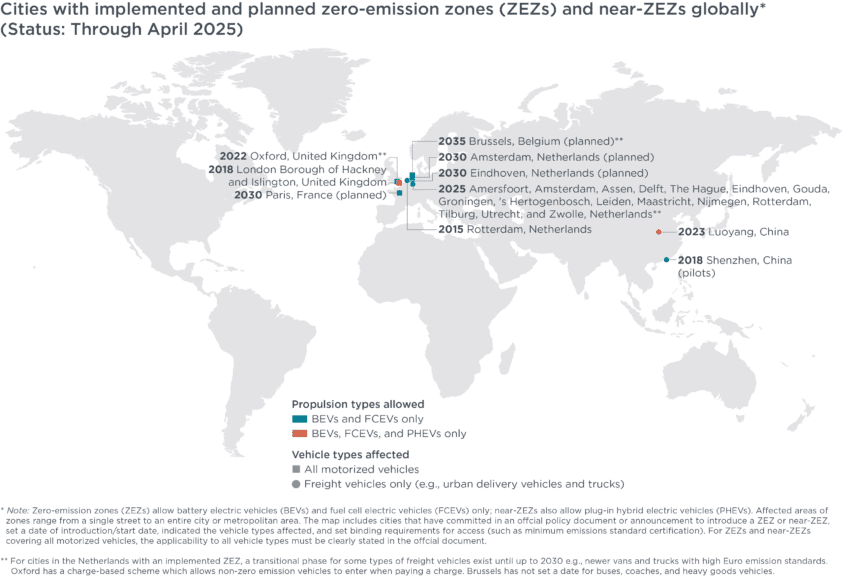
Zero-emission vehicle phase-ins: Zero-emission zones (April 2025)
Highlights cities with implemented and planned zero-emission zones (ZEZs) and near-ZEZs globally. Status: Through April 2025.
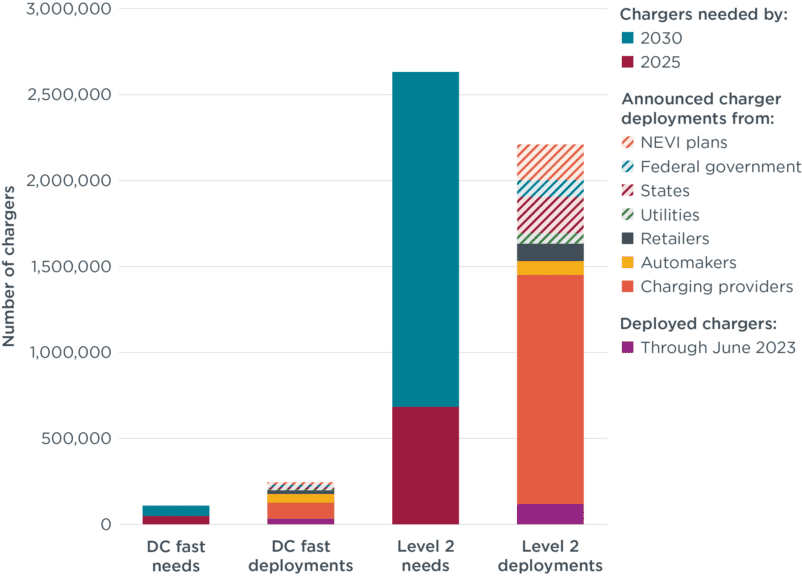
Non-home EV chargers needed by 2030 compared with announced deployments
Publicly available announcements from retailers, automakers, and charging providers sum up to 164,000 new DC fast chargers and 1.5 million new Level 2 chargers for light-duty vehicles in the years ahead. These investments cover a substantial share of the chargers we estimate will be needed by 2030—about 182% of the needed DC fast chargers […]
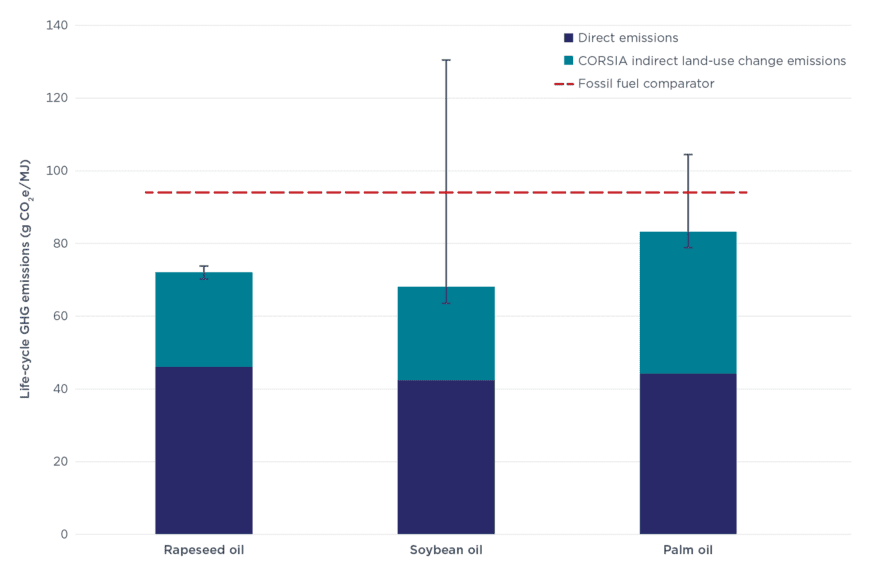
Life-cycle GHG emissions for HVO compared with a fossil fuel comparator of 94 CO2e/MJ (the ICCT’s estimate of the GHG intensity of fossil marine fuels)
ILUC values are from ICAO, which refers to two ILUC models to develop its values; error bars show ILUC values from each of these models. Rapeseed and soybean oils are global ILUC numbers, while the palm oil ILUC number is for Malaysia/Indonesia (no global number is available). Direct emissions are typical values from the European Union’s […]
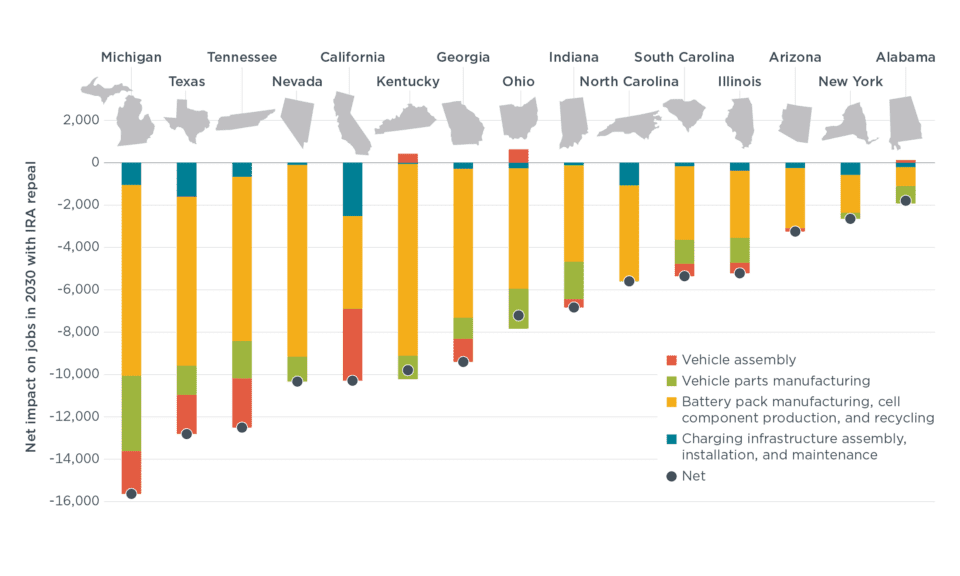
Net impact on jobs in 2030 with IRA repeal in the most impacted 15 states
This figure breaks down the net employment changes resulting from IRA repeal in each industry for the top 15 affected states in 2030. IRA repeal would lead to a loss of between 10,000 to 16,000 jobs in each of the top 5 states most affected, with 14 states projected to experience losses of more than […]
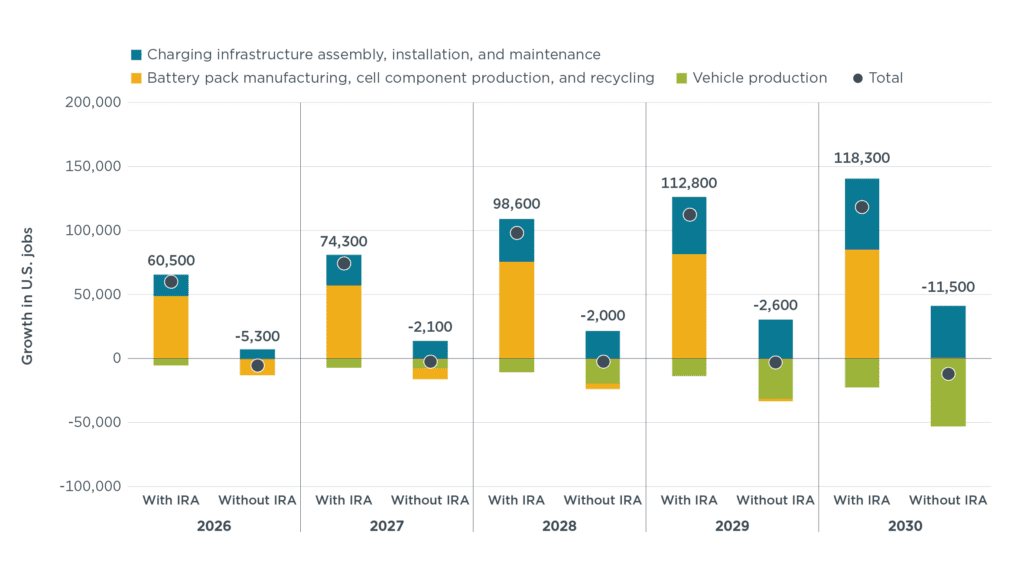
Projected growth in U.S. jobs compared with 2024 under the With IRA and Without IRA scenarios
This figure summarizes our findings on the job growth that would occur from 2026 through 2030 (compared with 2024) with and without the EV-related provisions in the IRA. Each bar shows the impacts in the vehicle production, battery manufacturing, and charging infrastructure industries, with the net impact across all three sectors indicated by a gray […]