Blog
Planes, Trains, and Automobiles: Counting Carbon
One question we’ve fielded lately with the release of our US airline efficiency ranking is how the fuel efficiency, and therefore carbon intensity, of aircraft compare to other modes of transportation. Vehicles meet a variety of transport needs, in terms of what is transported (people vs. goods), distance traveled (short intercity trips vs. transoceanic transport), and speed (12 mph on a bike vs. Mach 0.85 in a long-haul aircraft). Typically, travelers choose between different transport modes based upon a variety of criteria—cost, speed, comfort, even safety—with carbon footprint generally only a secondary consideration. But, for those relative few who would consider planning a trip with carbon dioxide emissions in mind, here are some preliminary thoughts.
Some previous comparisons have estimated a miles per gallon (mpg) value for aircraft, and compared that to the fuel economy of new passenger cars. This can lead to odd comparisons of fuel efficiency, such as that between a A380 superjumbo jet designed to carry 500-plus people across oceans and a car such as the Prius that is likely used predominately for short local trips. One trick is to make sure that one is comparing the fuel efficiency of vehicles across comparable trips, for example a 300 to 500 mile trip where a traveler might reasonably choose to take either a car, plane, bus, or train. Flying a short route, a plane will burn significantly more fuel per passenger mile more than flying a long route due to the relatively large amount of fuel consumed in takeoff. The problem has been knowing exactly how much. But as part of our airline ranking project we’ve made a good estimate of the fuel efficiency of aircraft across several important routes linking major US cities, which gives us a reasonable answer to that question.
Second, one needs to measure fuel efficiency on a common metric. The fuel economy of a car is often quantified in terms of miles per gallon, which is a poor metric for intermodal comparisons given the large difference in vehicle size across modes. A better metric is to compare vehicles on the metric of passenger miles per gallon, which is obtained by multiplying mpg by the number of passenger carried. Some previous comparisons have assumed an occupancy of one for cars, which may be appropriate for a commute but not for longer trips. According to data collected by the Oak Ridge National Laboratory, the average occupancy for passenger vehicles on longer leisure trips, which are most comparable to trips taken on planes, buses, and trains, is typically in the range of 2.2.
Third, one needs to correct for the fact that vehicles use different types of fuels, with buses, planes, and trains typically operated on denser, more carbon-intensive fuels than passenger vehicles. For example, one gallon of jet fuel contains about 127,000 BTUs, or about 11% more energy delivered than gasoline. A fairer comparison can be made by by normalizing each fuel to gallons of gasoline equivalents based upon energy content. Otherwise, a passenger-mile per gallon metric without energy conversions would favor planes and buses over cars.
On this metric—miles per gallon gasoline equivalent—we are able to compare the fuel economy of various transport modes on a mid-distance interurban trip. The results are summarized in Figure 1.
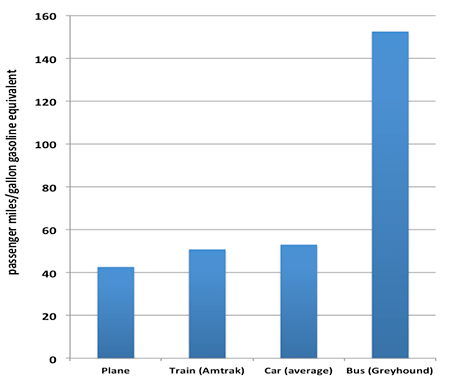
Figure 1 Fuel economy of various US transport modes on 300 to 500 mile trips
As Figure 1 demonstrates, we estimate that planes are currently the most fuel-intensive transport option at about 43 passenger miles per gallon jet fuel, or a little over 40 passenger miles per gallon gasoline equivalent (MPGge). The most energy efficient option is actually an interurban bus, at an estimated 152 passenger MPGge. Interurban rail and cars have intermediate values of 51 and 53 MPGge, respectively. One can make a similar comparison across modes for the future by correcting for mid-term technological improvements. Figure 2 summarizes the results of the same intermodal comparison based upon the average fuel efficiency of a hybrid car sold today, improved interurban buses such as those being produced for Greyhound, the anticipated California high-speed rail (CA HSR) project, and the A320-NEO currently under development by Airbus. As the figure demonstrates, the fuel efficiency of each mode improves without changing the relative ranking, although advanced trains and cars appear to be improving more rapidly than planes and buses.
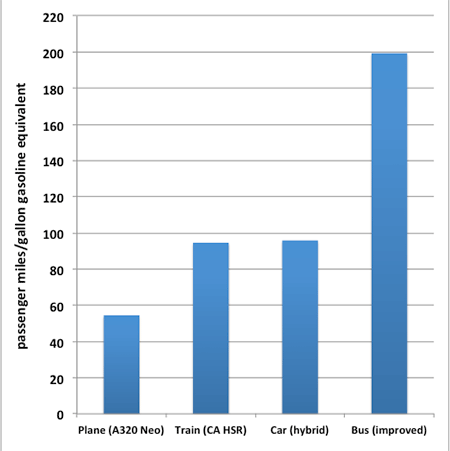
Figure 2 Projected fuel economy of various transport modes on 300 to 500 mile trips
Aircraft do offer considerable advantages to travelers such as speed, range, the ability to cross water, convenience, and even safety, but as a general rule they are the most carbon-intensive way to move people and goods. Furthermore, it appears unlikely that the gap between the fuel efficiency of planes and other modes will be closed anytime soon. ICAO has concluded that the fuel efficiency of new aircraft can be increased by between 65 and 80% for conventional wing-and-tube designs by 2030 given sufficient pressure. Given current trends of improvement, it seems likely that aircraft manufacturers will need to make even larger investments in fuel efficiency to keep pace with other transport modes.