Market Spotlight
European Market Monitor: Cars and vans (May 2025)
Passenger car registrations
Figure 1. Share of battery electric in new passenger car registrations in Europe

Figure 2. Average CO2 emissions of manufacturer pools and individual manufacturers compared with estimated 2025-2027 targets, 2025 YTD

Note: Includes compliance credits. All CO2 values are estimates according to the Worldwide harmonized Light vehicles Test Procedure (WLTP). Only manufacturer pools and individual manufacturers with at least 1% market share YTD are shown. See the section on definitions, data sources, methodology, and assumptions for more.
Carbon dioxide (CO2) emissions among manufacturer pools averaged 102 g CO2/km in May 2025. Manufacturing pools thus remain 9 g CO2/km from the average target of 93 g CO2/km for the 2025–2027 period. With a combined market share of 59%, the Tesla-Stellantis-Toyota and Volkswagen pools reduced their target gap by 1 g CO2/km compared with the previous month. The BMW pool is now the closest to its 2025–2027 target with a gap of 1 g CO2/km, while Nissan (29 g CO2/km above) remains the farthest from reaching its target.
Looking at individual car brands with market shares of 1% or greater, apart from Tesla, Volvo had the greatest over-compliance at 28 g CO2/km below its projected brand-level average target for 2025–2027, and it was followed by Cupra (16 g CO2/km below target). Mazda and Nissan currently have the largest target gaps at 28 and 29 CO2/km, respectively. While Audi’s target gap remains 25 CO2/km, that is a 3 g CO2/km reduction from the previous month.
Table 1. Share of battery electric, plug-in hybrid, full hybrid, and mild hybrid passenger cars by manufacturer pool or large manufacturer not forming a pool
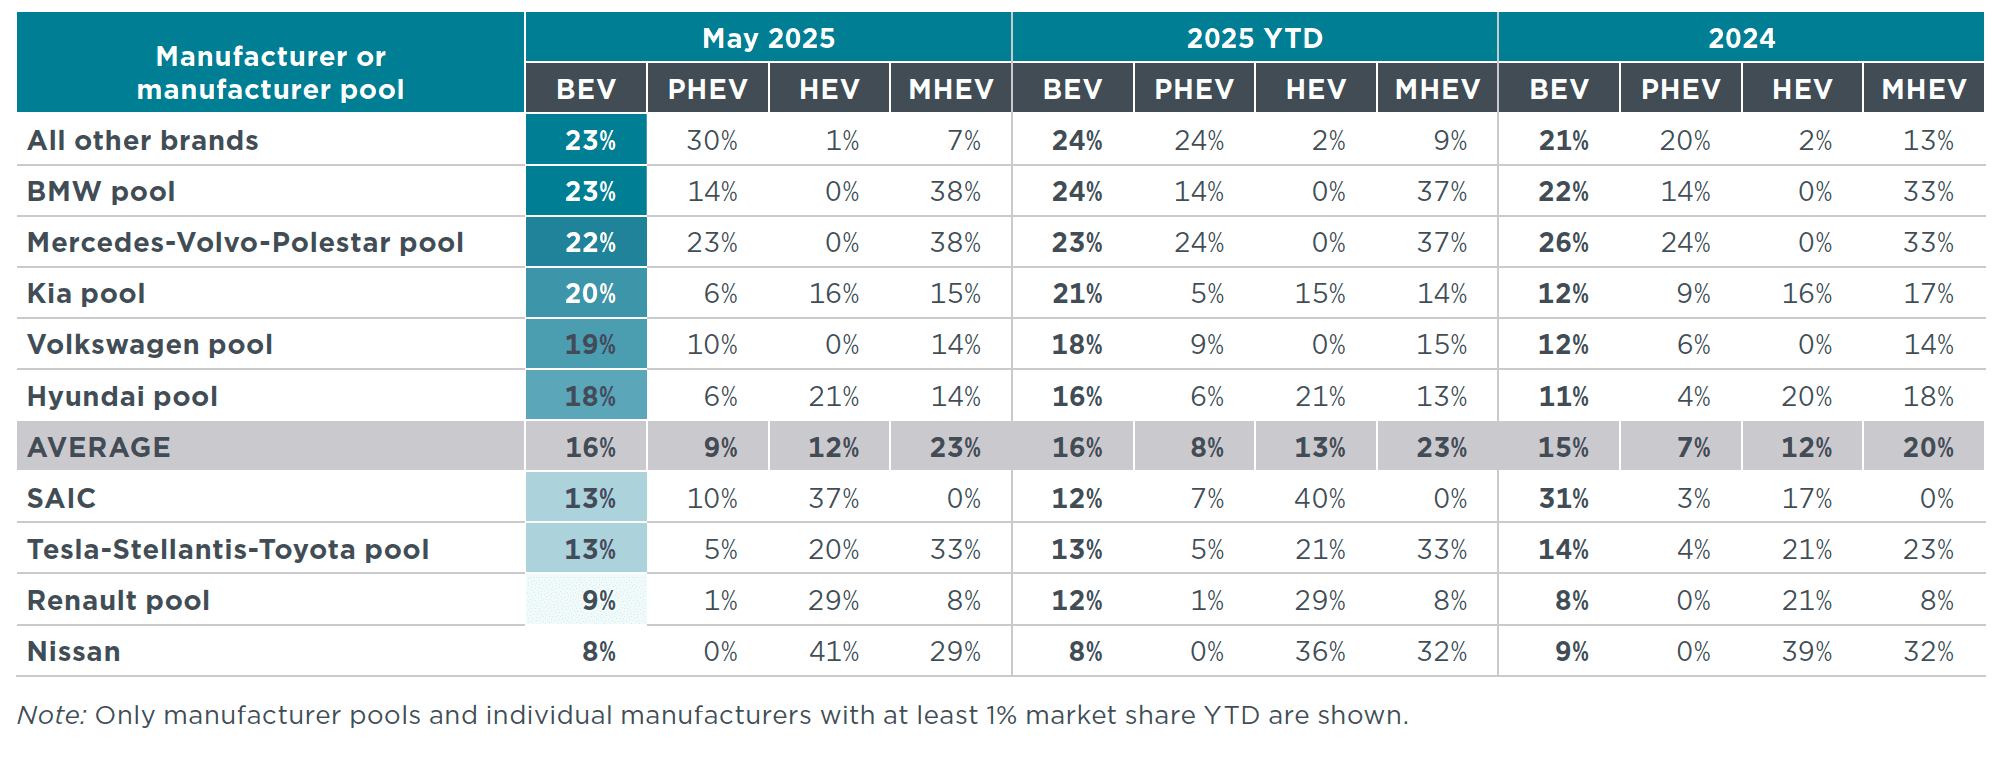
Table 2. Fleet-average CO2 emissions of new passenger cars and market share by manufacturer pool or large manufacturer not forming a pool
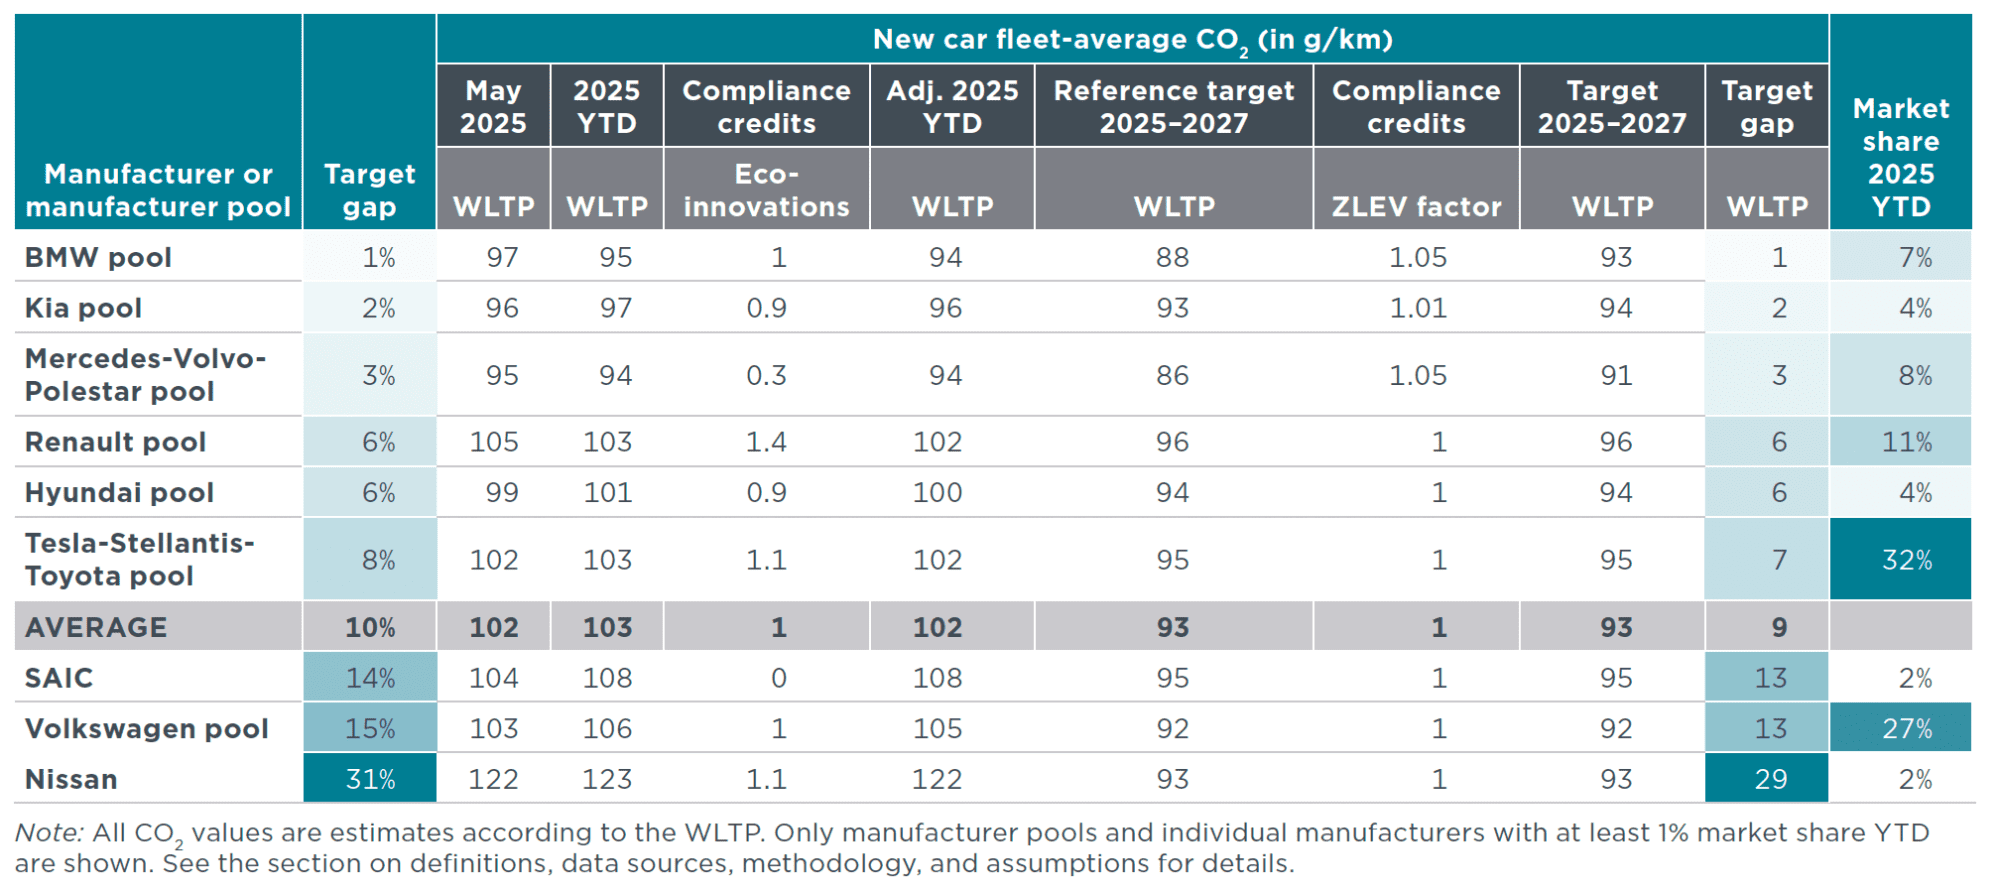
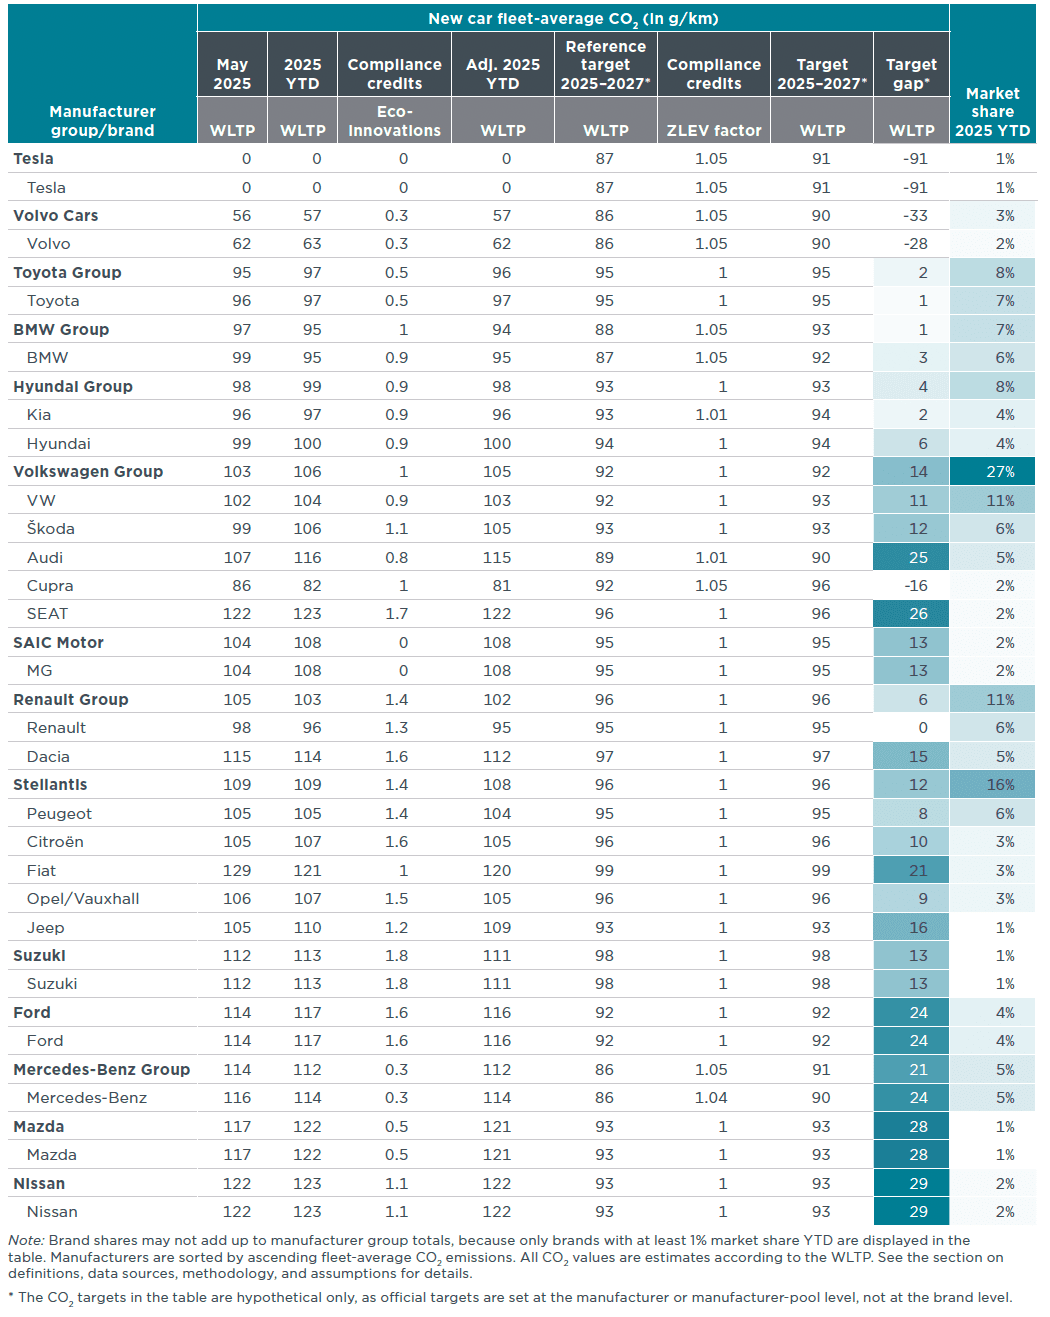
Table 3. Fleet-average CO2 emissions of new passenger cars and market share by manufacturer group and brand
Passenger car registrations by country
Looking at the major European markets, total passenger car registrations in France and Belgium each fell 12% in May 2025 compared with May 2024, and Italy again was the second largest market, ahead of France. Meanwhile, new registrations increased 19% in Spain compared with the same month in the previous year. Combined BEV and PHEV market shares in Europe increased to 25% YTD in 2025. Focusing on the largest markets by combined new BEV and PHEV registrations, Norway (96%), Denmark (66%), Sweden (60%), and the Netherlands (54%) all had combined shares above 50%, and Belgium (41%), Austria (30%), and Germany (27%) also recorded combined BEV and PHEV market shares above the average for Europe. Among the largest markets by total new passenger car registrations, the highest increase in BEV registrations occurred in Poland and Spain, where registrations increased 119% and 101%, respectively, in May 2025 compared with May 2024, and registrations in France dropped 19% compared with May 2024. In Germany BEV registrations continue to rise, with over 43,000 BEVs registered in May, a market share of 18%. As Europe’s largest market, this 45% increase over May 2024 is substantial. Registrations of PHEVs increased the most in Spain (+173%) and Poland (+109%) in May 2025 compared with May 2024 and HEV registrations increased the most in Spain (+27%). Shares of MHEVs were highest in Italy (30%) and Poland (27%) in May, and they are gaining popularity in Spain and France, where registrations increased 35% and 21%, respectively, in May 2025 compared with May 2024.
Figure 3. Share of plug-in hybrid and battery electric passenger cars by country, including information on market size (total new car registrations)

Note: The figure highlights the 10 largest markets by new BEV and PHEV registrations YTD. The “Other” category includes all remaining EEA countries not individually highlighted, except for Bulgaria, Liechtenstein, and Malta.
*Data for Austria covers January to April 2025 only. The same applies to Iceland and Portugal, both categorized under “Other.”
Table 4. New passenger car registrations by country
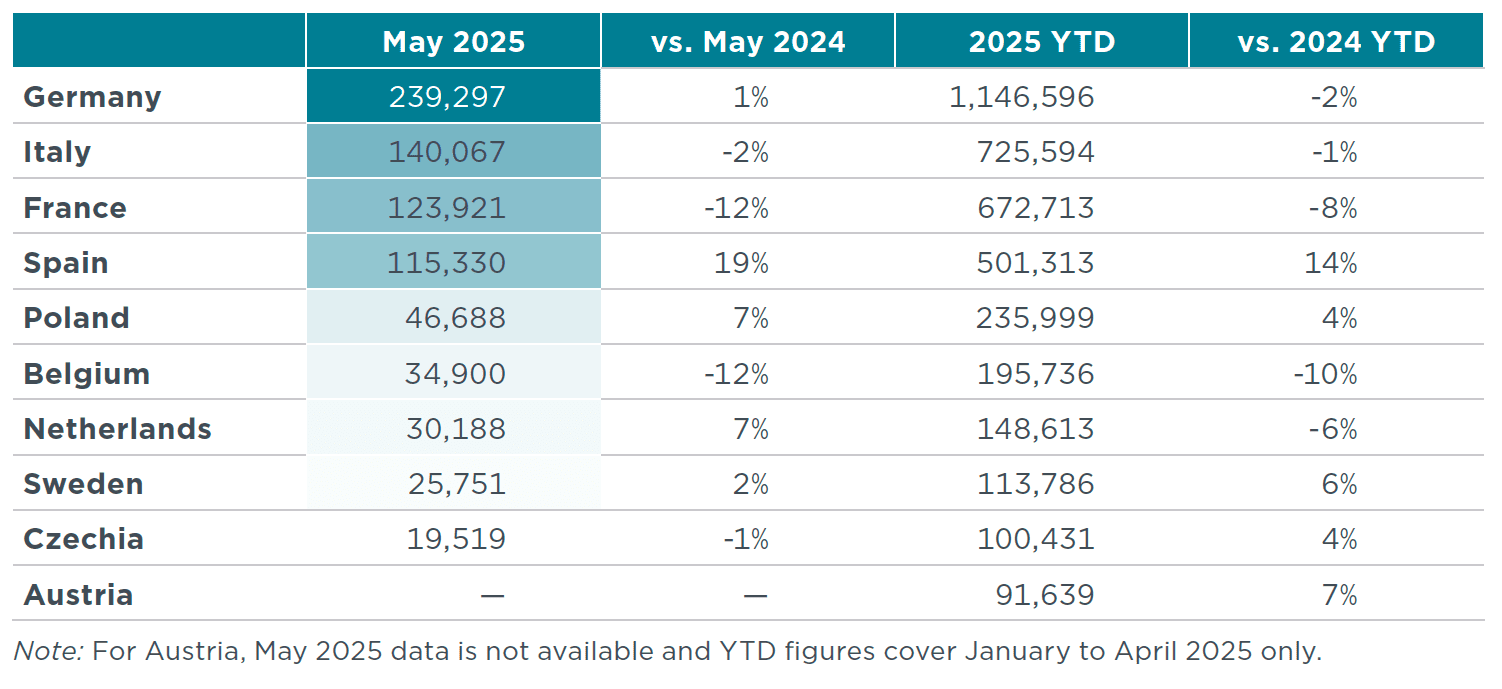
Table 5. New battery electric, plug-in hybrid, hybrid, and mild hybrid passenger car registrations by country
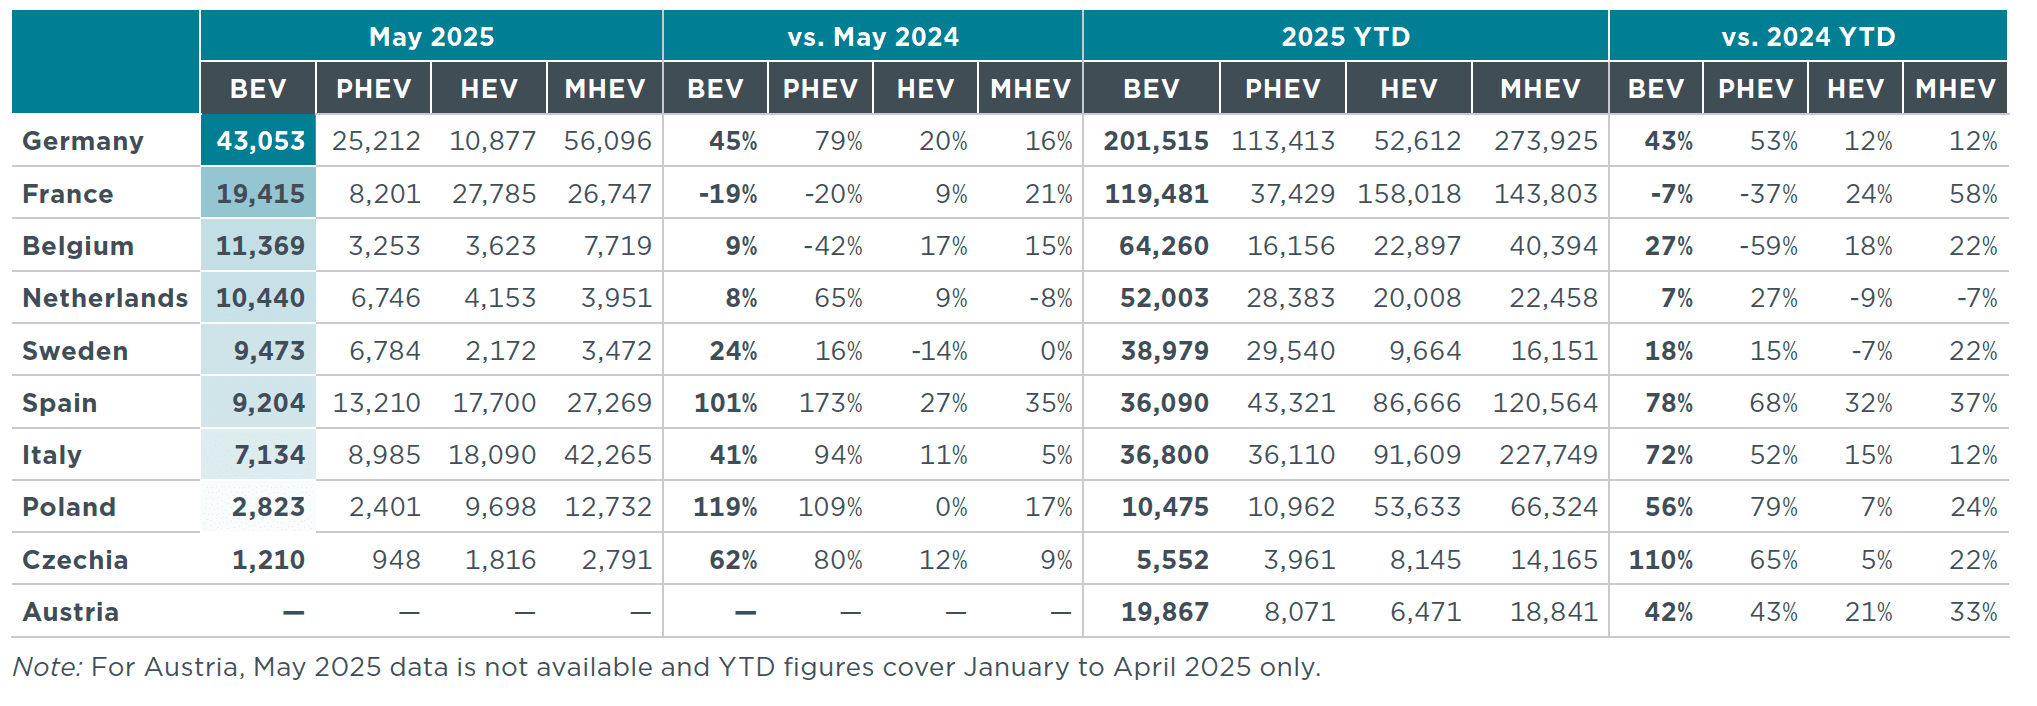
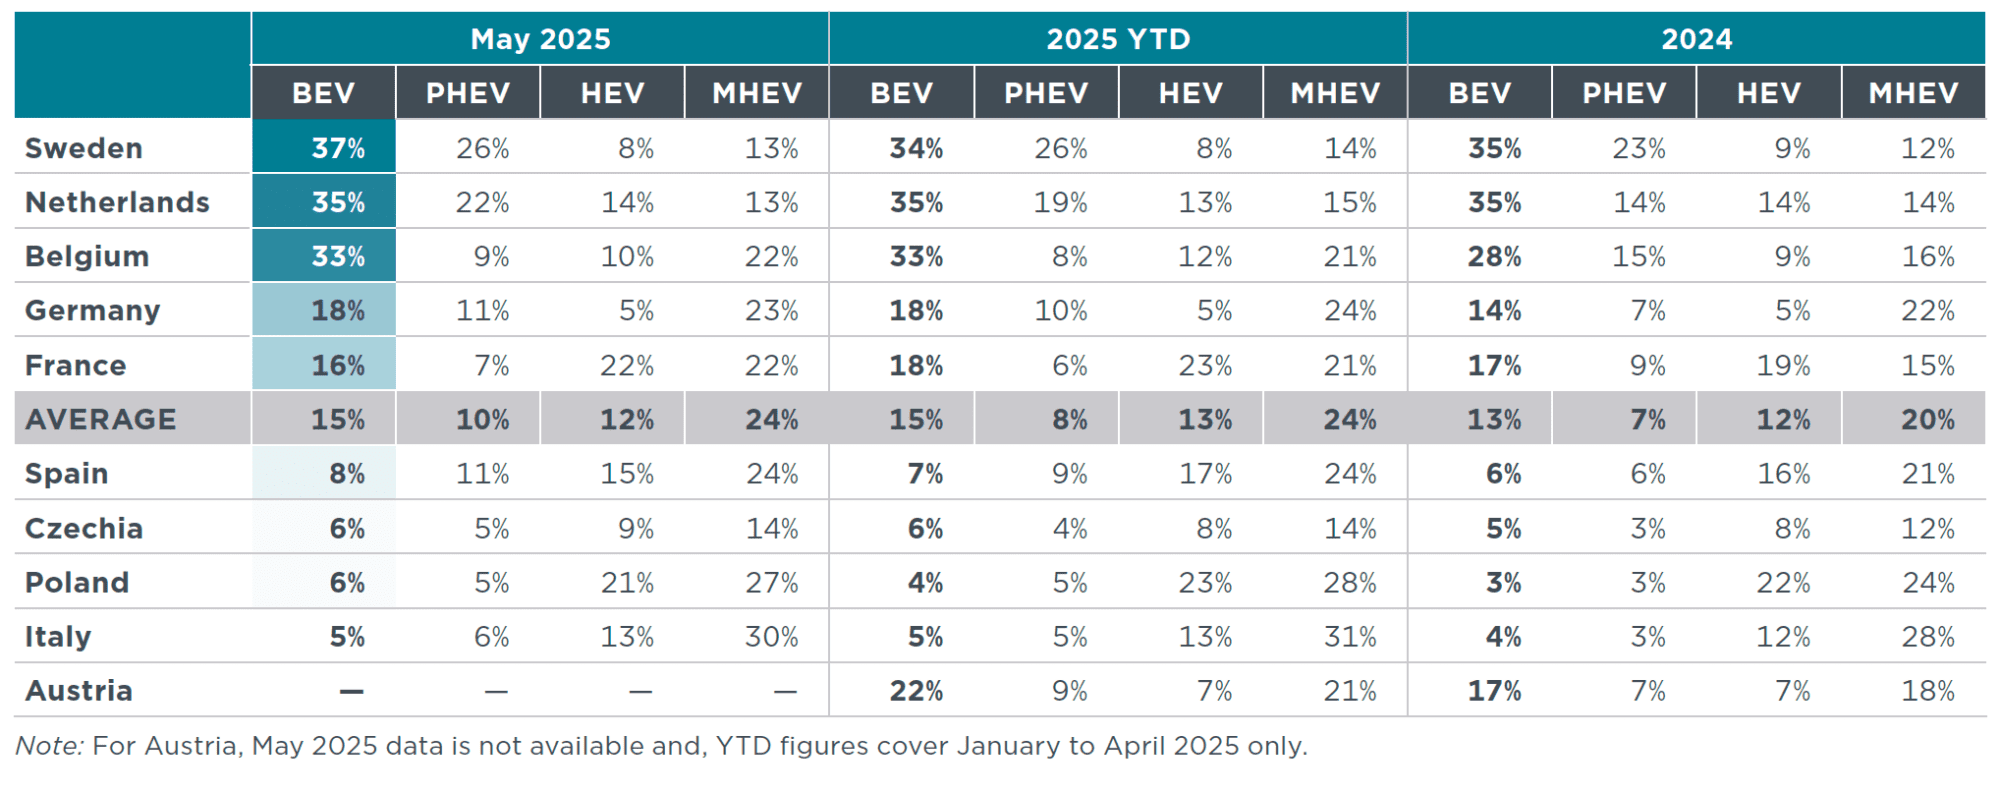
Table 6. Share of new battery electric, plug-in hybrid, full hybrid, and mild hybrid passenger cars by country
PASSENGER CAR REGISTRATIONS BY OWNER
Figure 4. New passenger car registrations by owner for 19 select European countries

Spotlight: EV uptake in selected global markets
Looking beyond Europe, BEV sales have seen strong growth in several emerging markets since 2023. In Southeast Asia, Thailand and Vietnam stood out in 2024; each doubled their BEV market share compared with 2023 and they reached 18% and 22% shares, respectively. In Q1 2025, the trend in Vietnam continued, with BEV sales (which are nearly all EV sales in the country) accounting for approximately 36% of new car registrations, nearly twice the 2024 average. This growth has been driven by strong domestic production, led by local manufacturer VinFast, and supportive government policies such as registration fee exemptions for EVs. Thailand is both a rapidly growing market for EVs and a major production hub—it is home to 43% of motor vehicle production in the ASEAN region. Thailand has set ambitious goals and provided tax incentives and subsidies to stimulate EV growth, including a goal for zero-emission vehicles to account for 30% of all vehicle production by 2030. Sales of BEVs in Thailand further rose in 2025 and comprised 23% of the market in Q1. PHEV sales further make up a small but rapidly expanding share of the market in Thailand and nearly tripled in Q1 2025 compared with the 2024 average.
In Latin America, Colombia and Mexico also experienced notable growth in 2024. Market shares for BEVs were 5% and 4%, respectively, and the absolute number of BEV sales roughly tripled year-over-year. This is attributable to government incentives and targets and expanded charging infrastructure. In Q1 2025, Colombia’s BEV market share rose to 8%, while in Mexico, a shift to PHEVs was observed, with a 1-percentage-point decline in BEV share accompanied by a 2-percentage-point increase in PHEV share.
In Türkiye, BEVs were 8% of new registrations in 2024, an increase of 3 percentage points compared with the previous year. This trend is expected to continue in 2025, and shares already surpassed 13% in Q1 2025. In contrast, the share of BEVs in Europe declined by 1 percentage point in 2024 compared with 2023, falling to 14%. However, it rebounded in Q1 2025 and rose to 16%.
Figure 5. Share of plug-in hybrid and battery electric passenger cars by country in selected global markets in 2023, 2024, and Q1 2025 (total new registrations)
Data for some markets covers additional vehicle categories (see note below).

Note: Markets are sorted in descending order of combined BEV and PHEV market share in Q1 2025. Vehicle categories covered vary by market. For China, Europe, India, Türkiye, and the United Kingdom, data includes passenger cars only. For Vietnam, data includes passenger cars, pickup passenger cars, and vans. For Thailand, data includes passenger cars, pickup passenger cars, and pickup trucks. For the United States and Mexico, data includes passenger cars and light trucks. Data for Colombia and Brazil is for passenger cars and light commercial vehicles. For vehicle category definitions, see Ilma Fadhil and Chang Sen, Global Electric Vehicle Market Monitor for Light-Duty Vehicles in Key Markets, 2024 (International Council on Clean Transportation, 2025), https://theicct.org/publication/global-ev-market-monitor-for-ldv-in-key-markets-2024-jun25/. Data sources: ABVE (Brazil), Gasgoo (China), ANDEMOS (Colombia), Dataforce (Europe, United Kingdom), Segment Y (India), EV Volumes (Mexico, United States), JATO (Mexico), Thailand Automotive Industry Association (Thailand), Hyundai Thanh Cong (Vietnam), Vietnamese Automobile Manufacturer’s Association (Vietnam), VinFast (Vietnam), and Automotive Distributors’ and Mobility Association (Türkiye).

This publication is a collaboration between the ICCT, IMT-IDDRI, and ECCO think tank.