Low-cost carriers and U.S. aviation emissions growth, 2005 to 2019
Blog
Airline fuel efficiency: ‘If you can’t measure it, you can’t improve it.’
Last March, I published a report that provided the first bottom-up, detailed fuel consumption inventory for all commercial flights to, from, and between US airports, using our Global Aviation Carbon Assessment (GACA) model. It showed that between 2005 and 2019, the fuel efficiency of US commercial airlines improved by 23%, or 1.5% per year (Figure 1, brown bar). This was in line with the industry’s goal of 1.5% average annual fuel efficiency improvement between 2009 and 2020. The efficiency achievement dampened growth in fuel consumption, keeping it well below the increase in demand for air travel (as measured by revenue passenger miles, or RPMs, and shown in the orange bar). In this way, fuel efficiency gains moderated the growth in carbon emissions from aircraft in the US.
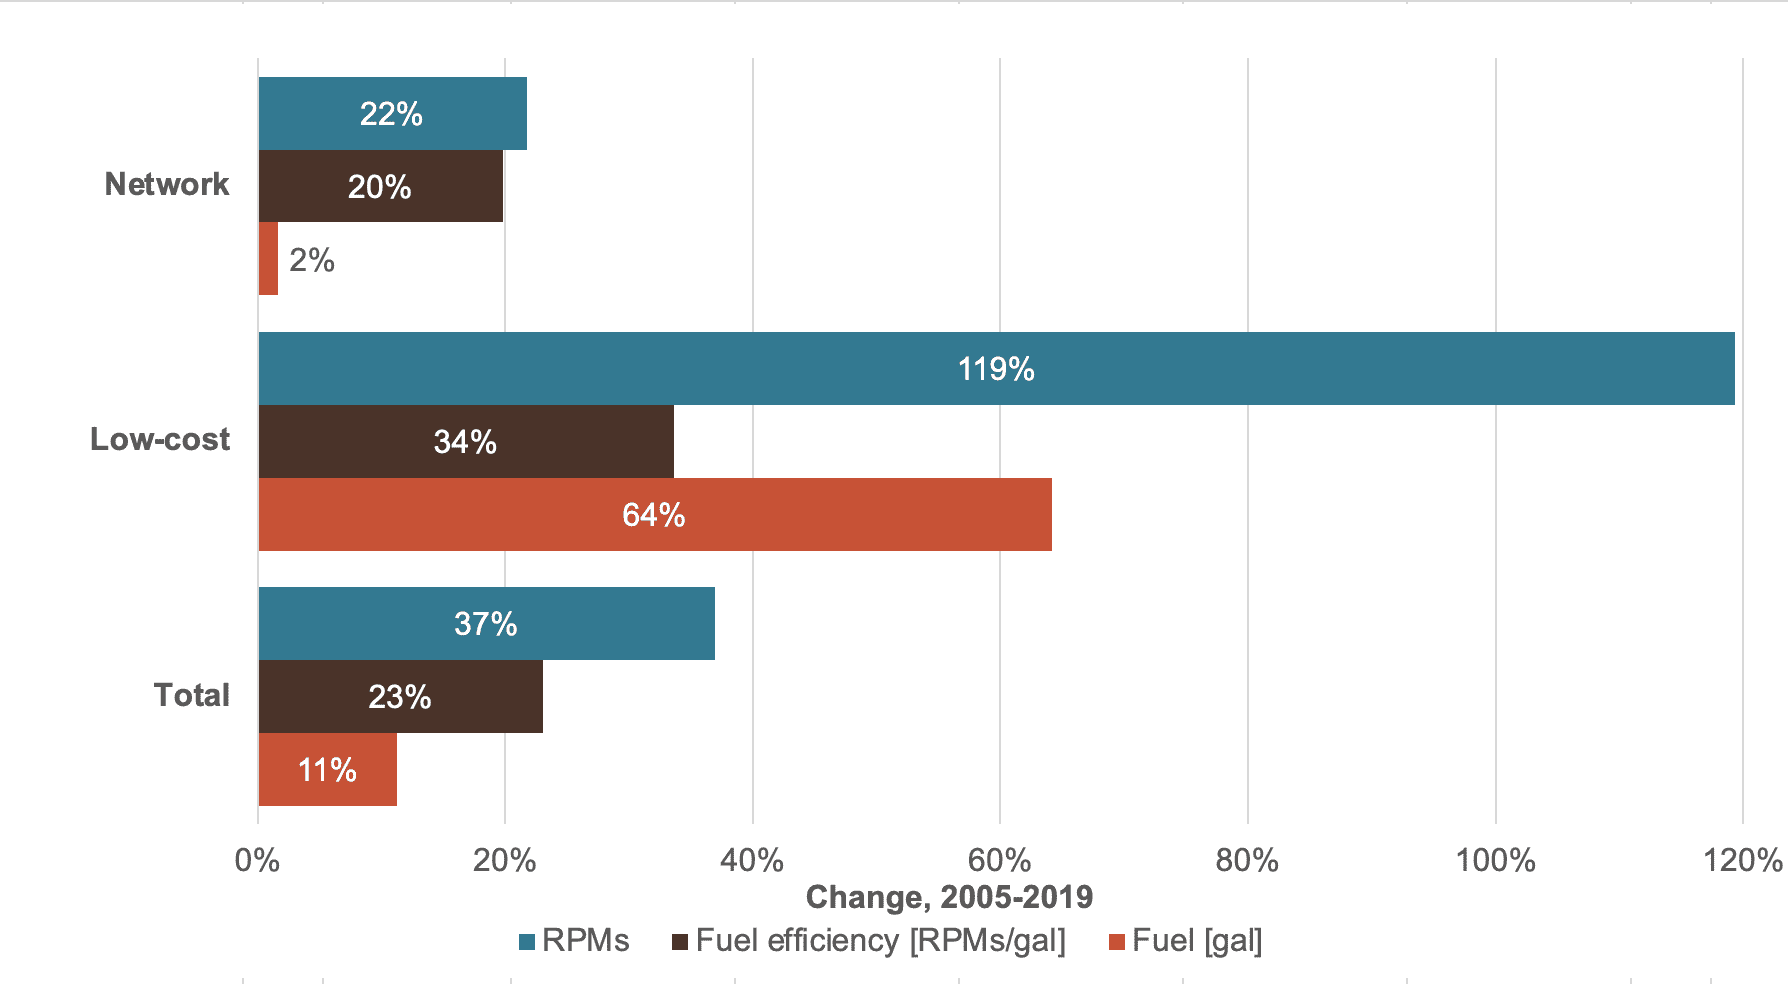
Figure 1. RPM, fuel use, and fuel efficiency growth by U.S. passenger air carrier type, 2005 to 2019.
What exactly is influencing these important gains? In previous reports, I have detailed five drivers of fuel efficiency—average fuel burn, passenger load factor, freight share, premium seating share, and seating density. Passenger transport burned four times as much fuel as cargo transport by US airlines during the period, so transporting freight and mail in the belly of a passenger aircraft would not likely explain the efficiency gains. Nor did the share of premium seating change markedly. Let’s look at each of the remaining three passenger-related drivers and see how they add up to 1.5%.
Aircraft fuel burn is measured by the margin from the International Civil Aviation Organization (ICAO) aircraft CO2 standard, which established an internationally agreed means of assessing and comparing fuel efficiency at the aircraft level. It is a measure of technological advances, such as the introduction of wingtip devices and new combustion engines, whose efficiency improvements are realized independent of how a plane is operated.
US passenger air carriers operate mostly narrowbody aircraft, accounting for more than two-thirds of traffic. Low-cost carriers (LCCs), which have driven traffic growth, tend to utilize the newest narrowbody aircraft. The fuel burn of US passenger aircraft fell by an average of 0.4% per year between 2005 and 2019 due to technology improvements. These account for approximately one-quarter of the total fuel efficiency improvement.
Payload efficiency is a measure of how well airlines fill their aircraft with passengers and freight. This can be done through upgauging (using larger aircraft), increasing seating density, and adjusting passenger load factors. As noted in the report on US airlines and shown in Figure 1, LCCs are generally more fuel-efficient than network carriers due to higher seating densities, higher passenger load factors, and a newer fleet.
The average number of seats on each aircraft has increased over the analysis period. In 2005, the average passenger aircraft had 102 seats. By 2019, that number increased to 127 seats, due to a shift to larger regional jets and narrowbody aircraft. (Larger planes typically translate to more passengers per liter of fuel burned, an increase in efficiency.) The fleet average reference geometric factor (RGF)—a close proxy for the pressurized floor area of an aircraft—increased 1.4% per year.
The seating density of each aircraft—the number of seats per m2 RGF—increased 0.4% per annum on average. This was led by an increase in LCC operations, which have an average of 23% more seats/m2 than in 2005.
Those additional seats did not fly empty; passenger load factors increased by 0.6% per annum. The percentage of filled network airline seats increased by 0.6% per year rate, but LCC average passenger load factor increased by 0.9% per year.
Overall, payload efficiency, as measured by passengers carried per unit of maximum takeoff mass (MTOM), increased by 1% per annum on US carriers from 2005 to 2019. That accounts for two-thirds of the fuel efficiency gains seen over that period.
Traffic efficiency improvements were not considered in previous airline ranking reports. These include upgraded navigation and air and ground traffic management and could account for the remaining 0.1% per annum average fuel efficiency improvement not covered by aircraft fuel burn and passenger transport operation improvements. This value is in line with operational efficiency scenarios used by the aviation industry in their decarbonization roadmap.
Figure 2 shows the per annum increase in the key fuel efficiency drivers for US air carriers between 2005 and 2019. As shown, the “easiest” way for airlines to increase their fuel efficiency over the period studied was by carrying more payload. Passenger carriers did that through a variety of means: increasing aircraft size, adding more seats per plane of a given size, and filling those seats at higher rates.

Figure 2. Key drivers of US airline fuel efficiency improvements, 2005 to 2019
We observed similar trends globally in some drivers for the 2013-2019 period that GACA investigated. The impact of technology on fuel efficiency for global airlines’ fleetwide fuel burn also decreased by 0.5% per year. Passenger load factor increased 0.9% per annum worldwide, with LCCs increasing by an average of 1% each year.
So, why is it important to determine the relative contributions of these efficiency variables? Because accelerating improvements in fuel efficiency, while not an end in itself, will contribute to net zero pathways for decarbonizing aviation. Yet airline fuel efficiency remains poorly defined as a jumble of aircraft fuel burn, payload efficiency, and traffic efficiency. ICCT’s aviation decarbonization roadmap, to be published soon, will help to disentangle these variables to clarify their contributions to the steady decarbonization of air travel. Keep an eye on the aviation program’s page for more to come in 2022…