STACKS
Five things you know about electric vehicles that aren’t exactly true
- Range
- Charging time
- Public charging stations
- Climate impacts
- Cost
- Credits and sources
Decarbonizing the transportation sector is one key to keeping global warming below 1.5˚C. And electric vehicles are the single most important technology to decarbonizing the transportation sector—EVs of all kinds, but especially light-duty vehicles, meaning primarily passenger vehicles. To put the world on that track, we estimate that sales of passenger car EVs need to reach between 35% and 75% of the global market in 2030, and exceed 75% between 2040 and 2050.
Governments, around the world and at all levels, recognize this. They are investing in the necessary infrastructure, creating incentives for car buyers and drivers, and pushing manufacturers to build and market more and better EVs. Automakers are responding with more models and more production. And, thanks in part to those systems of incentives and infrastructure investments, EVs are an increasingly viable choice for an average car buyer, in terms of consumer utility and cost.
But questions and concerns about EVs persist in the minds of some consumers, especially concerning convenience, cost, and real environmental impact. Often these concerns are rooted in misconceptions. This card stack takes a look at some of those cases.
-
Range
A persistent concern among some car buyers is that battery electric vehicles (BEVs) don’t have enough range—that they’d risk getting stranded because the battery has run out of power. A 2019 survey of American consumers, for example, found that more half cited the worry that they’d run out of charge while driving as a reason to hesitate over buying an EV.
Range anxiety has diminished as automakers introduce BEV models with longer driving ranges and the number of public charging stations increases. But a look at actual driving behavior makes it clear that BEVs on the market today have more than enough range on a single charge to handle the daily driving needs of the vast majority of drivers—usually several times over. For most drivers, range wouldn’t be a day-to-day concern.
The United States and Germany are two of the most car-centric countries in the world. People there buy a lot of new cars, and they drive a lot, which makes them good cases to study. Conveniently, they also collect good data on just how much they drive. And one thing that data shows is that even a BEV with a relatively low range of 200 km will go farther on a single charge than 96% of American and German drivers actually drive on an average day. Longer-range BEVs will handle effectively all drivers’ average daily travel.
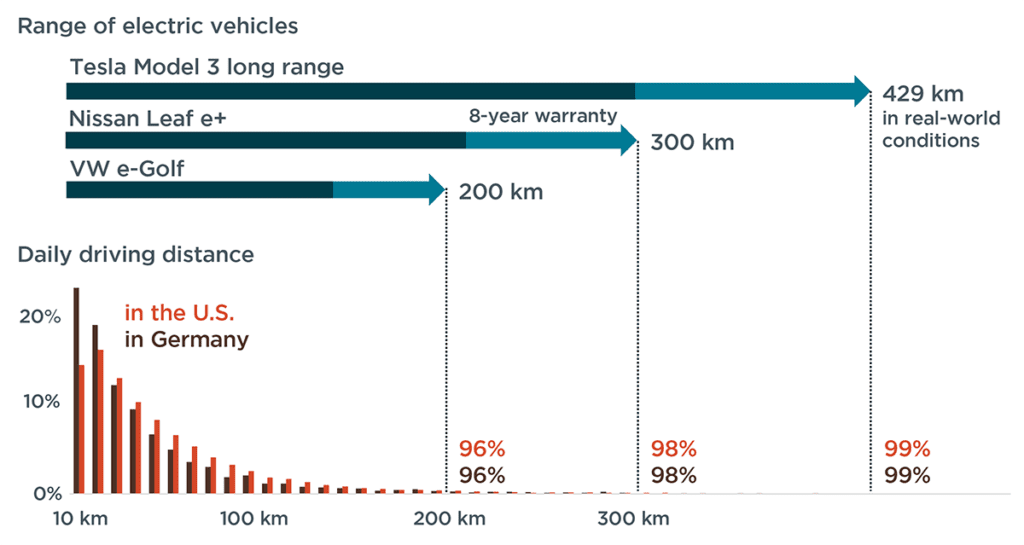
The chart here illustrates this point. The vertical bars represent average daily total distance driven in the United States (red bars) and Germany (brown), in 10 kilometer bins. That is, the leftmost pair of bars indicates that about 24% of car drivers in Germany and about 15% of drivers in the U.S. drive less than 10 kilometers (6 miles) on average per driving day, the next pair shows that about 20% of German drivers and 17% of Americans average between 10 and 20 kilometers, and so on. The horizontal bars show the range of three representative BEVs sold in both Europe and the United States: the long-range Tesla Model 3, the mid-range Nissan Leaf e+, and the VW e-Golf. The full bar represents range when new, the darker shaded portion of the bar shows range if the battery capacity has degraded to the point where it would be replaced or repaired under the manufacturer’s 8-year warranty (about 70% capacity). The most recent testing data suggests, however, that the type of lithium-ion batteries used in new BEVs can power a vehicle much longer than that warranty period would indicate—more than 1.6 million kilometers, or a million miles, well beyond a typical vehicle lifetime.

Range of select electric vehicles compared to the distribution of daily travel length in the United States and Germany. (Sources: For the United States, 2017 National Household Travel Survey. For Germany, Mobilität in Deutschland 2017 (analysis by Öko Institut); ADAC Ecotest.) The relatively low-range e-Golf has enough range to cover 96% of average daily driving in Germany as well as in the United States. If battery capacity degrades to the point where the warranty kicks in, the e-Golf would still cover about 93% of average daily travel in both countries. The Leaf and the Tesla, with higher-capacity batteries, cover effectively all daily average driving.
Moreover, about 89% of German and 87% of American car drivers drive on average less than 100 kilometers (60 miles) a day—that is, only half the range capacity of the e-Golf, one third of the Leaf’s, and less than a quarter of the Tesla’s range on a single charge.
These are averages, of course. And the distance a driver needs to travel on any given day may be more than average. Which leads to the questions of charging time, and public charging infrastructure.
-
Charging time
Another prevalent concern about EV performance among some consumers is charging time.
To really weigh this concern, we have to talk about power. Because charging time is a function of the amount of power being delivered to the EV battery, expressed in kilowatts (kW). More power, less time needed to charge. Power, in turn, is a function of voltage (volts, V) and current (amps, A). Also, for transferring energy quickly, the higher the voltage and the lower the current, the more efficient. Electric vehicles can charge on electrical circuits that deliver different amounts of power. The type of circuit and the maximum power that the vehicle can accept determine how long it will take.
Roughly speaking, EV charging points can be sorted into three categories according to charging speed and the type of connectors used:
- Slow charging with alternating current (AC) from the grid delivers a relatively low amount of power to the battery (up to 2.4 kW for the U.S. and 3.7 kW for Europe) but needs only a 120 V 20 A (U.S.) or 230 V 16 A (Europe) electrical circuit—the same as a kitchen microwave or hair dryer. Frequently called Level 1 charging in the United States, this type of charger uses a standard plug.
- Faster charging with AC delivers 7.2 kW (U.S.) to 7.4 kW (Europe) of power but needs a 240 V 30 A split-phase (U.S.) or 230 V 32 A (Europe) circuit—same as a water heater or a stove. Charging power can go up to 22 kW in European houses with a 400 V 32 A three-phase circuit. Generally called a Level 2 charging station in the United States, this type of charging requires a special plug. In Europe these are either called fast home chargers or simply normal chargers in public areas.
- Rapid charging or ultra-rapid charging, generally called Level 3 charging in the United States, delivers direct current (DC) at a power of 50 kW to 100 kW—and, with the newest charger designs, even up to 350 kW to premium EVs that can accept it. The voltage and current requirements of these charging stations aren’t analogous to anything you’d find in a residence or commercial business; think instead of your smartphone AC/DC adapter, but times 20,000. The charger converts the alternating current from the grid into a direct current with a voltage in line with the battery.
Another way to categorize charging points is by location: slower charging points—Level 1 and lower-power Level 2—can be wired into the electrical service at most residences or commercial businesses for drivers to use while they’re at home or at work. Faster charging points—rapid chargers and faster Level 2 chargers—need dedicated and more expensive electrical service, and so are more commonly found (and more useful) at public, high-traffic places—highway rest stops, grocery stores, or parking lots, for example.
Electric vehicle battery capacity is defined in terms of kilowatt-hours (kWh), the amount of energy the battery can deliver or take in at a given power (kW) for a certain time (h). Determining how long it takes to charge a battery from flat to full is a fairly straightforward calculation that depends mainly (but not only) on the charging power and battery capacity—at the same charging point, longer-range EVs will, logically, take longer to fully charge from a flat battery than short range vehicles. The table below shows reported charging times for our three representative EVs:
Model (battery capacity, real-world range*) Volkswagen e-Golf
(36 kWh, 201 km)Nissan Leaf e+
(62 kWh, 300 km)Tesla Model 3 Long-range (75 kWh, 429 km) Slow charging, 3.7 kW AC
(flat to full)10.25 h 18 h 23.25 h Fast charging, 22 kW AC
(flat to full)5.25 h 10 h 7.75 h Rapid charging, 50 kW DC
(10% to 80%)0.6 h 1.03 h 1.2 h Fastest charging, 250–350 kW DC
(10% to 80%)0.6 h 0.58 h 0.36 h * Range tested by ADAC
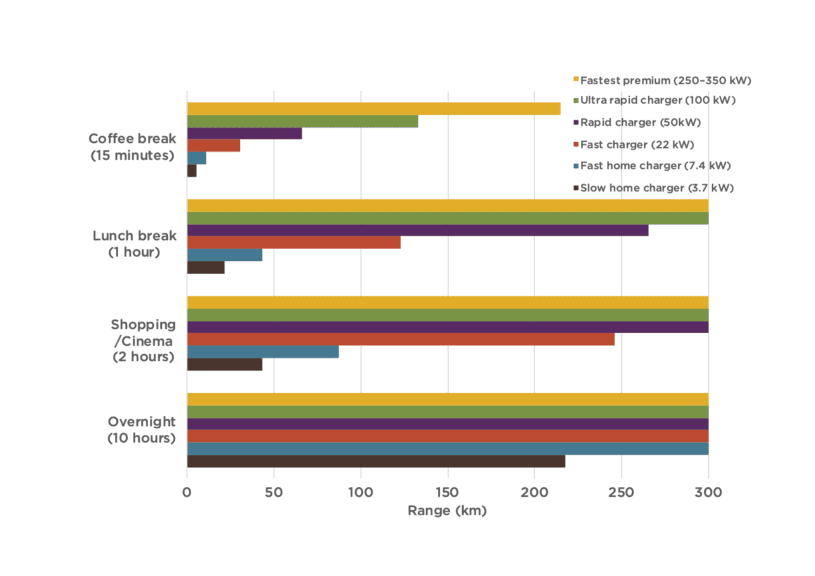
To the driver, of course, what matters is not kilowatt hours but kilometers (or miles): how much range is gained by a given amount of charging time? That calculation is less straightforward because the electric energy consumption of an individual model (in kWh/100 km) varies with the driving conditions. But the chart below shows estimated range gained by an average new (2020) BEV in the EU after charging for different lengths of time at different types of charging stations. The estimate takes into account a typical energy consumption of 17 kWh/100 km, a real-world range of 300 km, typical charging rates for 10%–80% state of charge (not just peak rate), and battery energy losses during charging.
The bars in the chart stop at 300 km because that’s the full range of this average BEV, but a longer-range model, such as the Tesla Model 3 Long-range, would of course continue adding range. So, during a one-hour lunch break plugged into an ultra-rapid (100 kW) charger, the Tesla would gain close to its full 400+ kilometer range.
What does all this mean to a potential BEV buyer concerned about charging time? To begin with, if her vehicle, like most vehicles, is most often parked at home or at work, and if she, like 96% of German and American drivers, drives on average less than 200 kilometers (124 miles) each day, she might notice that charging overnight or all day even at a slow charging point—such as could be installed at her home or business—will provide that much distance. And on days when she has to drive farther than the range of her BEV, an hour at a public charging point with even the slowest type of fast charger will provide her with well over 100 kilometers of additional range—and at a rapid charger will probably fully recharge her BEV’s battery.
-
Public charging stations
A recent survey of American consumers on their attitudes toward electric vehicles found about the same percentage concerned about the availability of charging infrastructure as about range. But in both cases the percentage had declined from what a similar survey done two years before had found, and one can speculate that in both the reason was the same: the rapidly changing context. Just as BEV range has improved, the number of public charging points is increasing rapidly in both the United States and Europe.
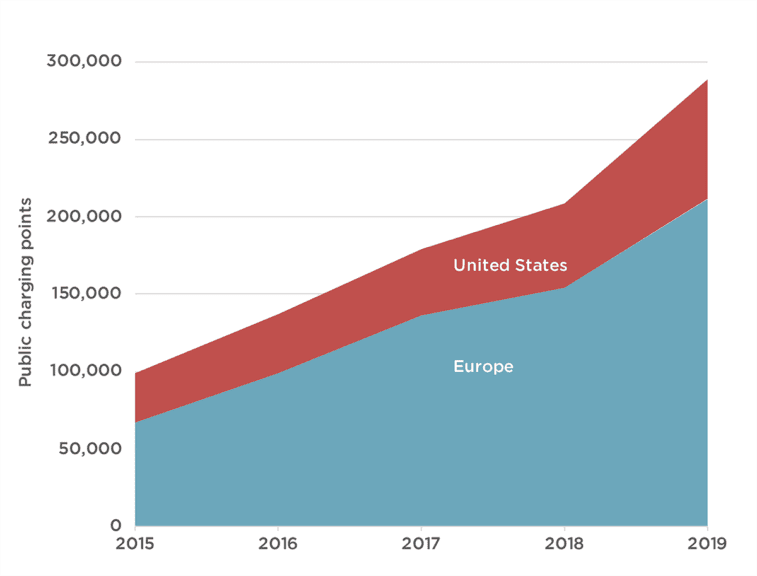
The chart below shows the trend. Between 2015 and 2019, the number of public charging points grew in Europe from roughly 67,000 to 211,000, and in the United States from 32,000 to 77,000.
And those numbers are set to increase at even more rapid rates in coming years, as governments at all levels build or incentivize the building of more infrastructure. The European Commission has called for installing one million charging points by 2025. U.S. President-elect Joe Biden pledged during his campaign to build a national network of 500,000 public charging points. EU member states and U.S. states are intensifying support: New York recently committed to invest $750 million in BEV infrastructure, and California approved nearly $450 million to install ~40,000 chargers; Germany plans to expand its charging infrastructure network to one million public charge points by 2030, and aims to invest more than €3 billion in charging infrastructure for cars and trucks by 2023. Municipal governments, like the City of London, are committing funding and creating incentives to expand their charging networks, one of numerous steps they’re taking to encourage the BEV market. Growth in the public charger network is also being promoted through building codes, as in France, where new buildings are required to include appropriate electrical infrastructure.
One factor in assessing the public charging network is the reality that most EV owners charge at home or at work. A 2018 survey of California EV drivers found that nearly 85% reported using home charging regularly, compared to only 11% that used public charging only. A survey on mobility conducted for the German Federal Ministry of Transport and Digital Infrastructure found that 92% of BEVs owned by private households are parked on private parking premises, nearly all of which have or could have charging capability.
So, while a BEV buyer has every reason to be confident in public charging infrastructure (depending to some extent, of course, on exactly where she lives; growth in the charging network tends to occur in conjunction with growth in EV sales, and neither is evenly distributed geographically), much does depend on governments following through on their plans to invest in that infrastructure and stimulate private sector investment, and indeed to increase the level of both public and private sector investments. A series of ICCT studies of regional charging infrastructure needs, examining (thus far) the United States, United Kingdom, and Germany, along with the cities of London and San Francisco, highlights the gap between the installed charging network and what will be needed to support the much larger fleet of BEVs that a decarbonizing transportation sector will require.
-
Climate impacts
Some dispute the idea that EVs are really much better for the climate than conventional internal combustion engines. Their arguments generally turn on two claims: that manufacturing EV batteries is very energy-intensive, and that the power from the electrical grid that fuels the EV produces just as much carbon emissions as burning diesel or petrol in an engine does. The first claim is true in principle, but much less relevant than is often believed. The second is simply wrong. Even when charged from a dirty, coal-dominated electrical grid, like in China or India, the carbon emissions associated with EVs are significantly lower than for conventional vehicles—especially when considering that the grid can and will become cleaner over time.
Another factor in that misconception is a failure to consider the carbon emissions related to producing and transporting fuel. For gasoline and diesel, these upstream emissions add about 20% to the emissions of fuel combustion itself. In all, considering both production and operation over a vehicle lifetime, the carbon emissions associated with driving a BEV in the United States are about half those of a conventional car (see below). In the EU, they’re only a third. This gap is only going to grow wider as more renewable power comes on-line and battery manufacturing becomes more energy and resource efficient.
The greenhouse gas emissions of producing a typical NMC111-graphite lithium-ion battery vary between 65 and 100 kilograms CO2 eq. per kWh of battery capacity, depending on whether the battery is produced with electricity from the relatively clean European grid, the U.S., or the coal-intensive Chinese grid. For a vehicle with a typical battery capacity of 45 kWh, this adds 3 to 5 tonnes of CO2 eq. to the 7 tonnes of CO2 eq. emitted in producing a conventional car. That is, building a battery electric vehicle is about 1.5 times as carbon intensive as building a comparable conventional vehicle. The difference is attributable to the emissions from manufacturing the battery itself, including all emissions upstream of the actual manufacturing process, such as those associated with mining and processing the raw materials.
But EV emissions are lower in use than those of conventional vehicles. There are two factors in this. One is the electric grid, which is decarbonizing across the globe. The other is the high efficiency of electric motors. EVs require much less energy to move from one point to another. While the internal combustion engine of a conventional car utilizes only 30% of the combustion energy, an electric motor achieves around 80% efficiency in average operating conditions. This high efficiency is also related to the fact that when EVs brake they recover part of the energy that was initially needed to accelerate the vehicle (called regenerative braking). The energy consumption of an average lower medium-segment BEV in Europe, such as an e-Golf or a Chevy Bolt, is 20 kWh/100 km (including charging losses). This is equivalent to using the energy content available in about 2.3 liters of petrol to travel 100 kilometers, or a fuel economy of over 104 miles per U.S. gallon. An EU average new lower medium petrol car, in contrast, consumes about 7 liters per 100 kilometers.
The upshot is that an EV quickly pays back the higher manufacturing-phase emissions. Exactly how quickly depends on the energy mix of the electrical grid where the vehicle is charged—what proportion comes from renewables, natural gas, nuclear, and coal or oil. For an EU average BEV charging with the average European grid, it would take about 18,000 kilometers, or between one and two years for an average driver. When charging with a U.S. average grid, it would take about 12,500 miles (20,000 kilometers). Over its useful life, a BEV charged on the EU grid, average mix, would end up emitting close to two-thirds less greenhouse gases than its petrol-powered counterpart.
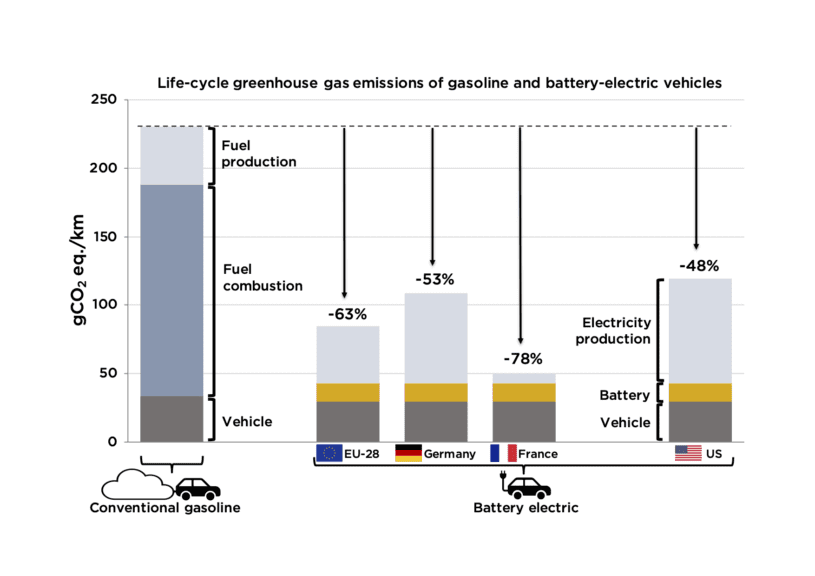
The figure below summarizes the climate impacts of passenger BEVs versus conventional passenger vehicles. It compares greenhouse gas emissions in CO2 equivalent per kilometer driven over the lifetime of the vehicle (252,000 kilometers, or ~157,000 miles, over 18 years) for an EU average new lower medium/C-segment gasoline and a battery-electric car charged in the European Union (average grid mix), Germany, France, and the United States.
*See below for notes and sources.With progress in battery development that can reasonably be expected, especially through more efficient manufacturing, improved cell chemistry, and the use of low-carbon energy in production facilities, the climate impact of the battery production should fall by a third by 2030. When including benefits from second-life use and recycling, the overall GHG emission impact of batteries decreases even further.
*Figure notes and sources: The gasoline car data shown in the figure reflect the NEDC fuel consumption of a 2019 average EU lower-medium gasoline car adjusted to real-world fuel consumption based on the ICCT Lab-to-Road studies. The GHG emissions for fuel production (including indirect land-use change of biofuel production) and combustion are taken from JEC 2020 and the GLOBIOM study. The BEV WLTP electric energy consumption and gross battery capacity correspond a 2019 average EU lower-medium BEV. Electricity consumption is adjusted to real-world using a 119% factor based on ADAC Ecotest (including charging losses). The carbon intensity of electricity consumption over the vehicle lifetime is based on the projected mix of energy sources in the 2020–2038 timeframe, reflecting the assumed vehicle life of 18 years, and a decline in annual mileage of 4% per year. Within an EU average annual mileage of 14,000 km the lifetime mileage of the vehicles sums up to 252,000 km. For the electricity supply, the life-cycle GHG emission intensities of the individual energy sources are median values from the IPCC, and transmission and distribution losses are based on World Bank data. For the EU, France, and Germany, the projected mix of energy sources corresponds to net electricity production in the JRC POTEnCIA tool (central estimate), while for the United States IEA WEO 2020 (new policy scenario) data is used. The GHG emissions attributable to the battery correspond to the 2019 average EU lower-medium BEV gross battery capacity (45 kWh, based on EV Volumes sales data) and a 75 kilogram CO2 eq./kWh carbon intensity of NMC622-graphite cells and an assumed mix of batteries produced in China and the EU. Second-life usage and recycling benefits are not included. “Vehicle” GHG emissions correspond to the production of glider and powertrain (including recycling) and maintenance (5 g CO2 eq./km for petrol cars, 4 g CO2 eq./km for BEVs).
-
Cost
The initial purchase price of battery-electric vehicles remains generally higher than comparable ICE vehicles, though the gap is narrowing rapidly as battery costs continue to come down, and we anticipate straight manufacturing cost parity within a few years. But purchase subsidies and other incentives, such as lower registration taxes or VAT exemptions, already reduce and in some cases exceed the price differential. And, more important, purchase price is only part of the cost of owning a vehicle. When fuel and maintenance are factored in, the total cost to own an EV approaches the cost of comparable ICE vehicles after a few years, even without considering purchase incentives or other subsidies. And for used-car buyers, the low-in use costs of EVs are a great benefit.
Net purchase price—retail price minus any purchase subsidies—can vary significantly between different government jurisdictions and even from year to year, as the animation below illustrates. The bars illustrate the cost savings over ten years of purchasing a Volkswagen e-Golf (100 kW) in November 2020 over its comparable petrol version (96 kW) in Spain (ES), Italy (IT), France (FR) and Germany (DE), assuming constant energy prices and tax policies and including the incentives contained in economic recovery incentive packages those countries passed in response to the COVID-19 emergency.
The chart also illustrates the influence of operating costs on total cost of ownership (TCO). While the e-Golf shows a savings in each country at time of purchase, thanks to the 2020 economic stimulus subsidies, savings in use over the ensuing years represents between 56% (Germany) and 98% (Italy) of the total. Over ten years the cost savings from the e-Golf is greatest in France, in large part because the cost of electricity is very low there.
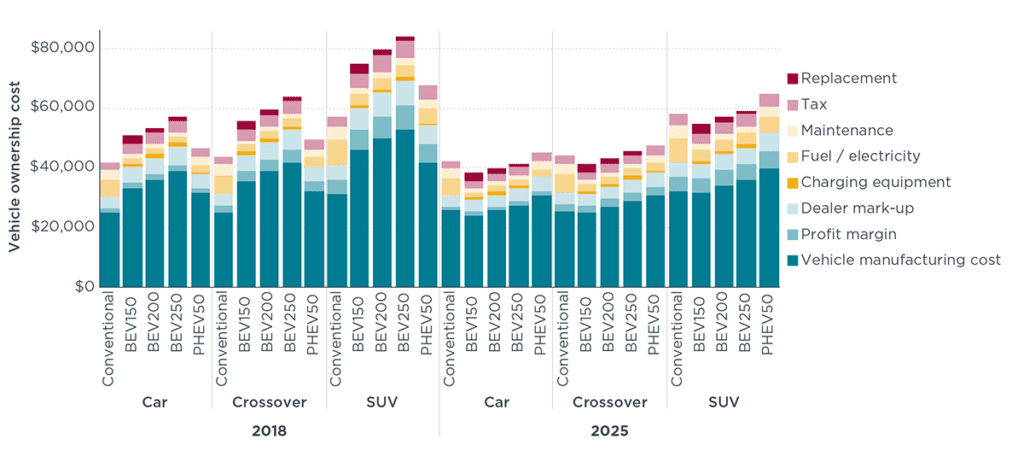
The chart below shows a slightly different and more detailed look at the same situation in the United States, using data from 2018.
Source: Lutsey/Nicholas, Update on electric vehicle costs in the United States through 2030.
The chart summarizes the projection made in this 2019 ICCT analysis that the total cost of ownership of both low-range (BEV150) and mid-range (BEV250) battery-electric vehicles would fall below that of comparable conventional vehicles in the car, SUV, and crossover vehicle segments by 2025.
In an indication of how rapidly this picture is shifting, an October 2020 analysis by Consumer Reports, with the benefit of Consumer’s own extensive data on car owners’ maintenance costs, estimates that in the U.S. market today, “Owning an electric vehicle will save the typical driver $6,000 to $10,000 over the life of the vehicle, compared to owning a comparable gas-powered vehicle.” Those savings accrue because, CR found, the “average EV driver will spend 60% less to power their vehicle than the owner of a gas-powered vehicle,” and “EV owners are spending half as much to repair and maintain their vehicle as owners of gas-powered vehicles.”
-
Credits and sources