Market Spotlight

European Market Monitor: Cars and vans (June 2025)

Passenger car registrations

The average share of battery electric vehicles (BEVs) among total new registrations in Europe reached 18% in June 2025 and 17% in the first half (H1) of 2025, compared with 13% in H1 2024. Several manufacturing pools had significant increases in BEV shares in H1 2025 compared with the same period in 2024. Kia (20%) and Volkswagen (18%) both recorded increases of 8 percentage points, and BEV shares for BMW (25%) and Hyundai (17%) pools each increased 6 percentage points. In contrast, SAIC stood out with a drop from a 41% BEV share in H1 2024 to 13% in H1 2025. The BMW pool had the highest BEV share in June (25%) and was followed by the Mercedes-Volvo-Polestar (23%), Hyundai (19%), Volkswagen (18%), and Kia (18%) pools, and SAIC (18%). The Tesla-Stellantis-Toyota pool (17%), Renault pool (11%), and Nissan (6%) were below the European average in June. Plug-in hybrid electric vehicles (PHEVs) had an average market share among new registrations in Europe of 8% in H1 2025 (up 1 percentage point over H1 2024), led by the Mercedes-Volvo-Polestar pool (23% share). SAIC and Nissan had the largest shares of full hybrid electric vehicles (HEVs) with 40% and 36%, respectively, in H1 2025 and the Mercedes-Volvo-Polestar and BMW pools led in new registration shares of mild hybrid electric vehicles (MHEVs) in H1 2025 with 38% and 37%, respectively.
Figure 1. Share of battery electric in new passenger car registrations in Europe

Figure 2. Average CO2 emissions of manufacturer pools and individual manufacturers compared with estimated 2025-2027 targets, 2025 YTD

Note: Includes compliance credits. All CO2 values are estimates according to the Worldwide harmonized Light vehicles Test Procedure (WLTP). Only manufacturer pools and individual manufacturers with at least 1% market share YTD are shown. See the section on definitions, data sources, methodology, and assumptions for more.

Carbon dioxide (CO2) emissions among manufacturer pools averaged 102 g CO2/km in H1 2025. Manufacturing pools thus remain 9 g CO2/km from the average target of 93 g CO2/km for the 2025–2027 period. With a market share of 32%, the Tesla-Stellantis-Toyota pool reduced its target gap by 1 g CO2/km compared with the previous month. The BMW pool is now on track to meet its 2025–2027 target, while Nissan (29 g CO2/km above) remains the farthest from reaching its target.

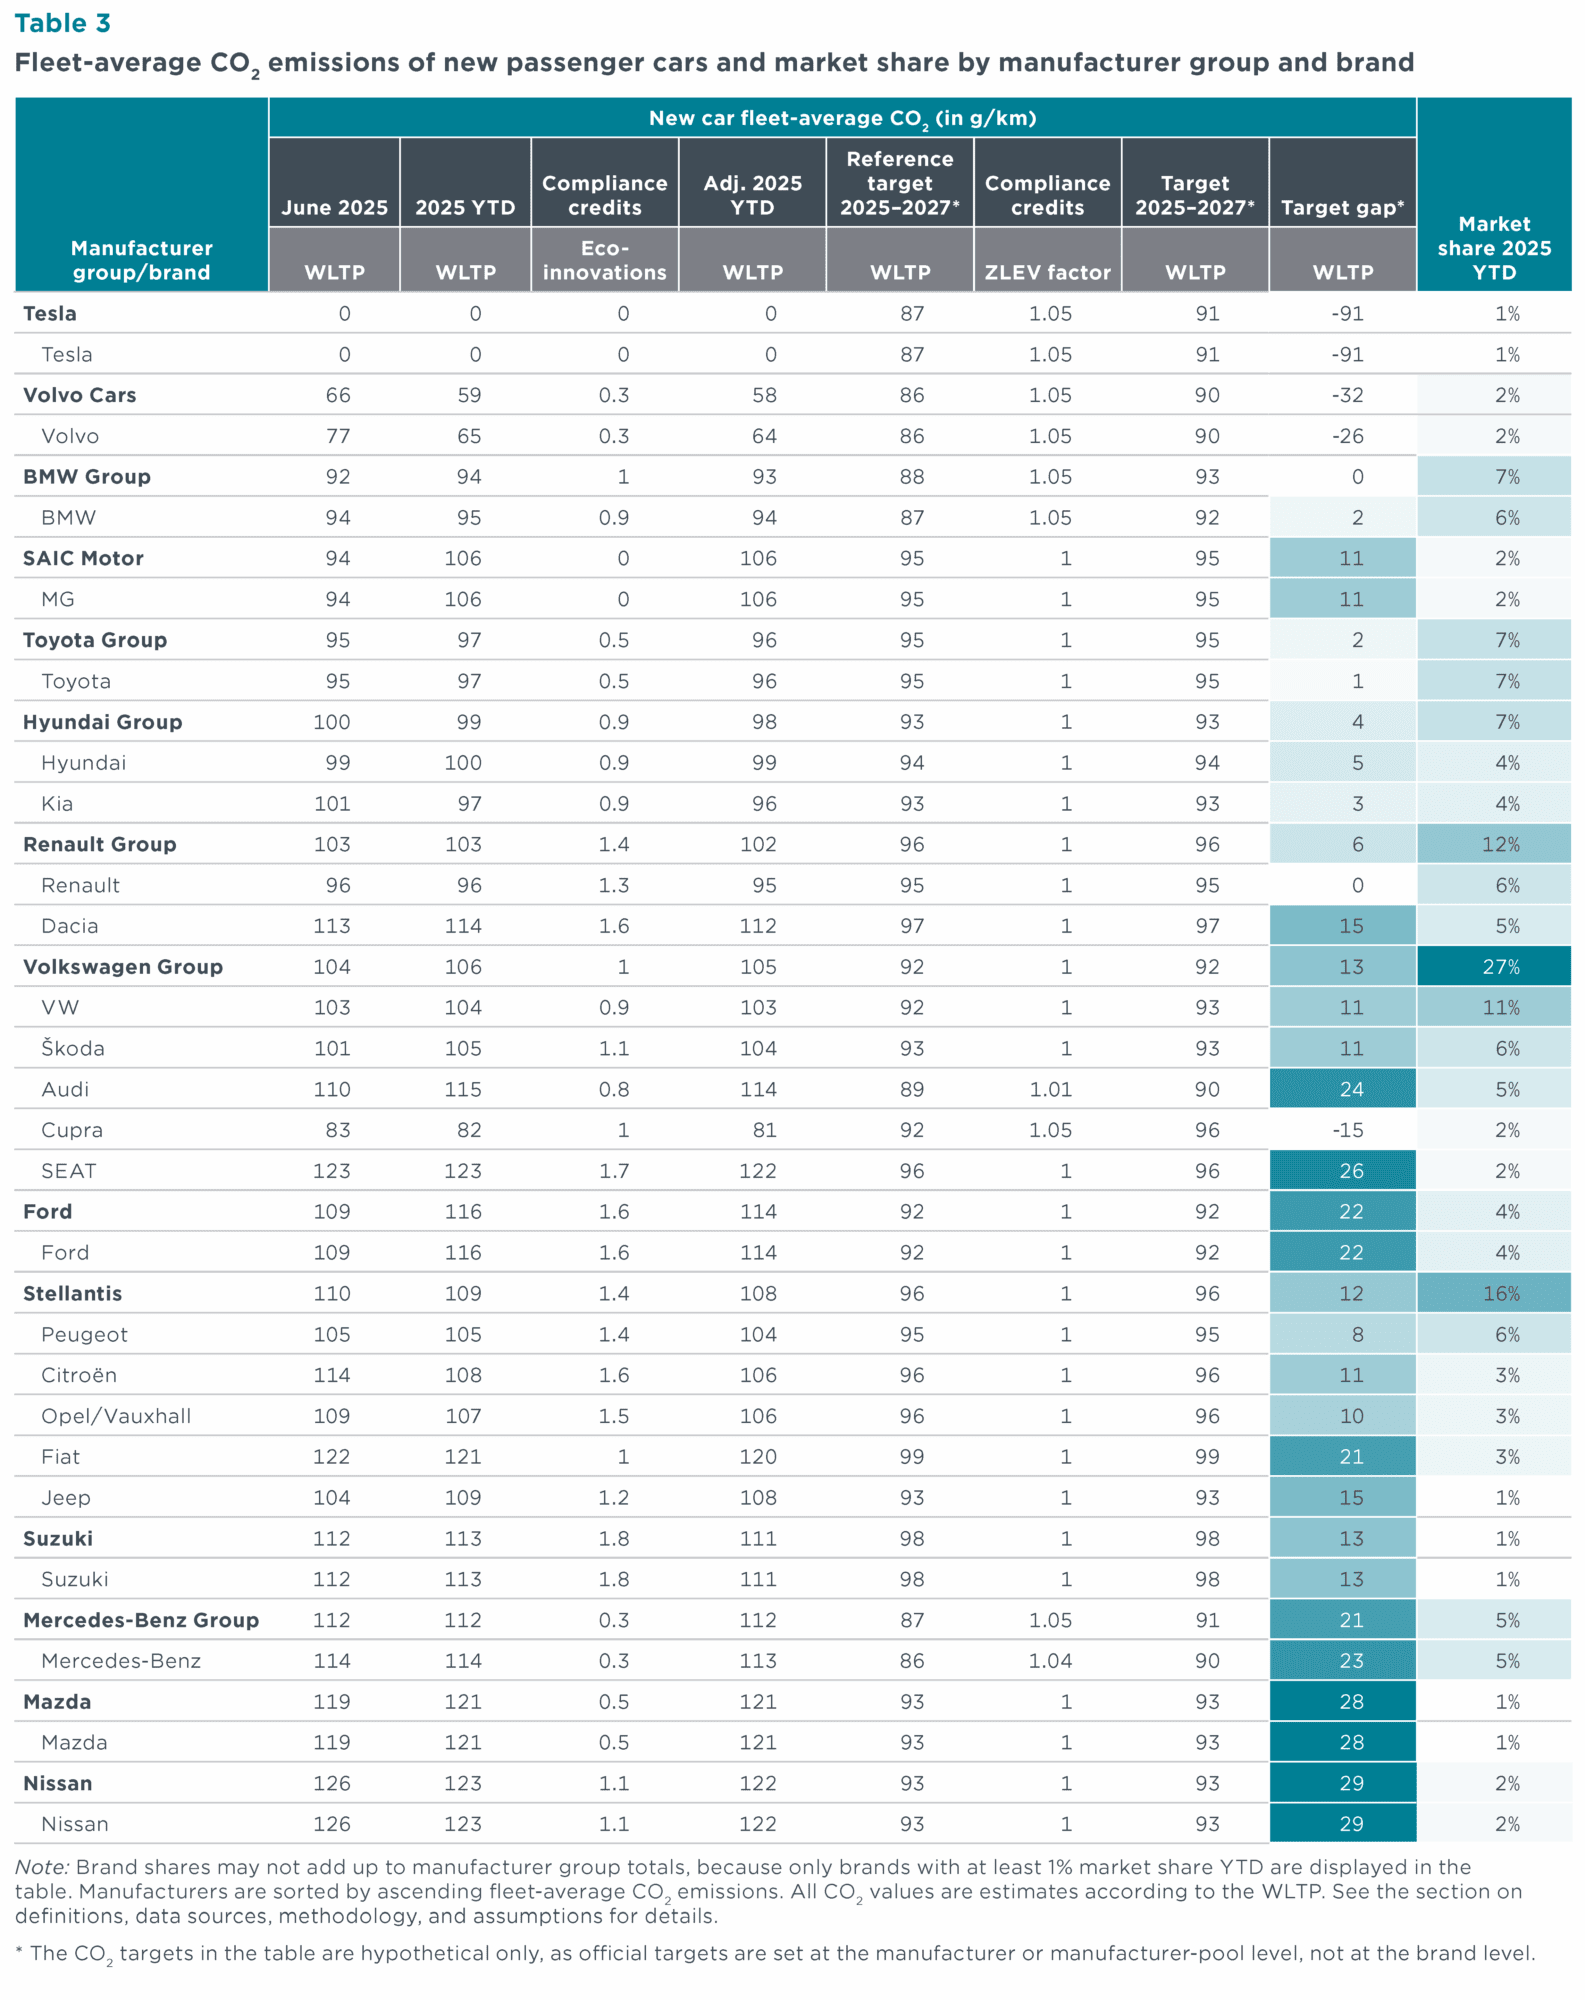
Looking at individual car brands with market shares of 1% or greater, apart from Tesla, Volvo had the greatest over-compliance at 26 g CO2/km below its projected brand-level average target for 2025–2027, and was followed by Cupra, which was 15 g CO2/km below its target. Mazda and Nissan currently have the largest target gaps at 28 and 29 CO2/km, respectively.

Table 1. Share of battery electric, plug-in hybrid, full hybrid, and mild hybrid passenger cars by manufacturer pool or large manufacturer not forming a pool

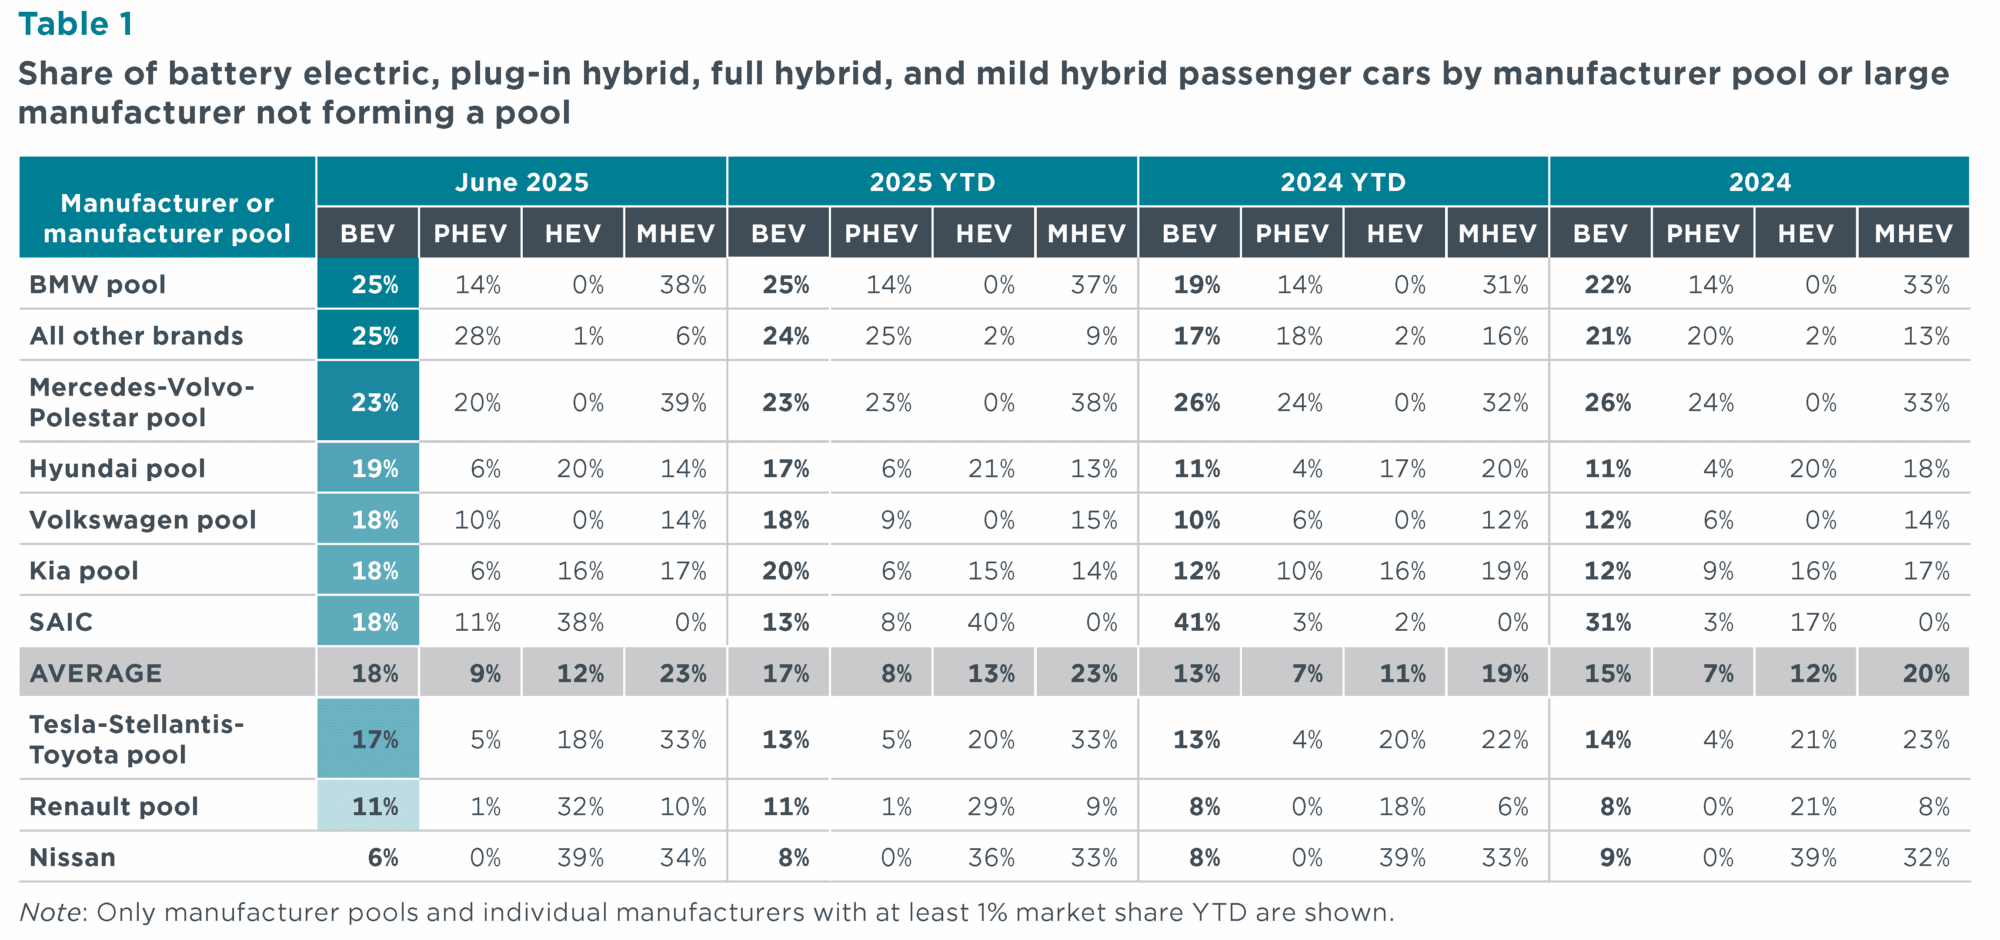
Table 2. Fleet-average CO2 emissions of new passenger cars and market share by manufacturer pool or large manufacturer not forming a pool

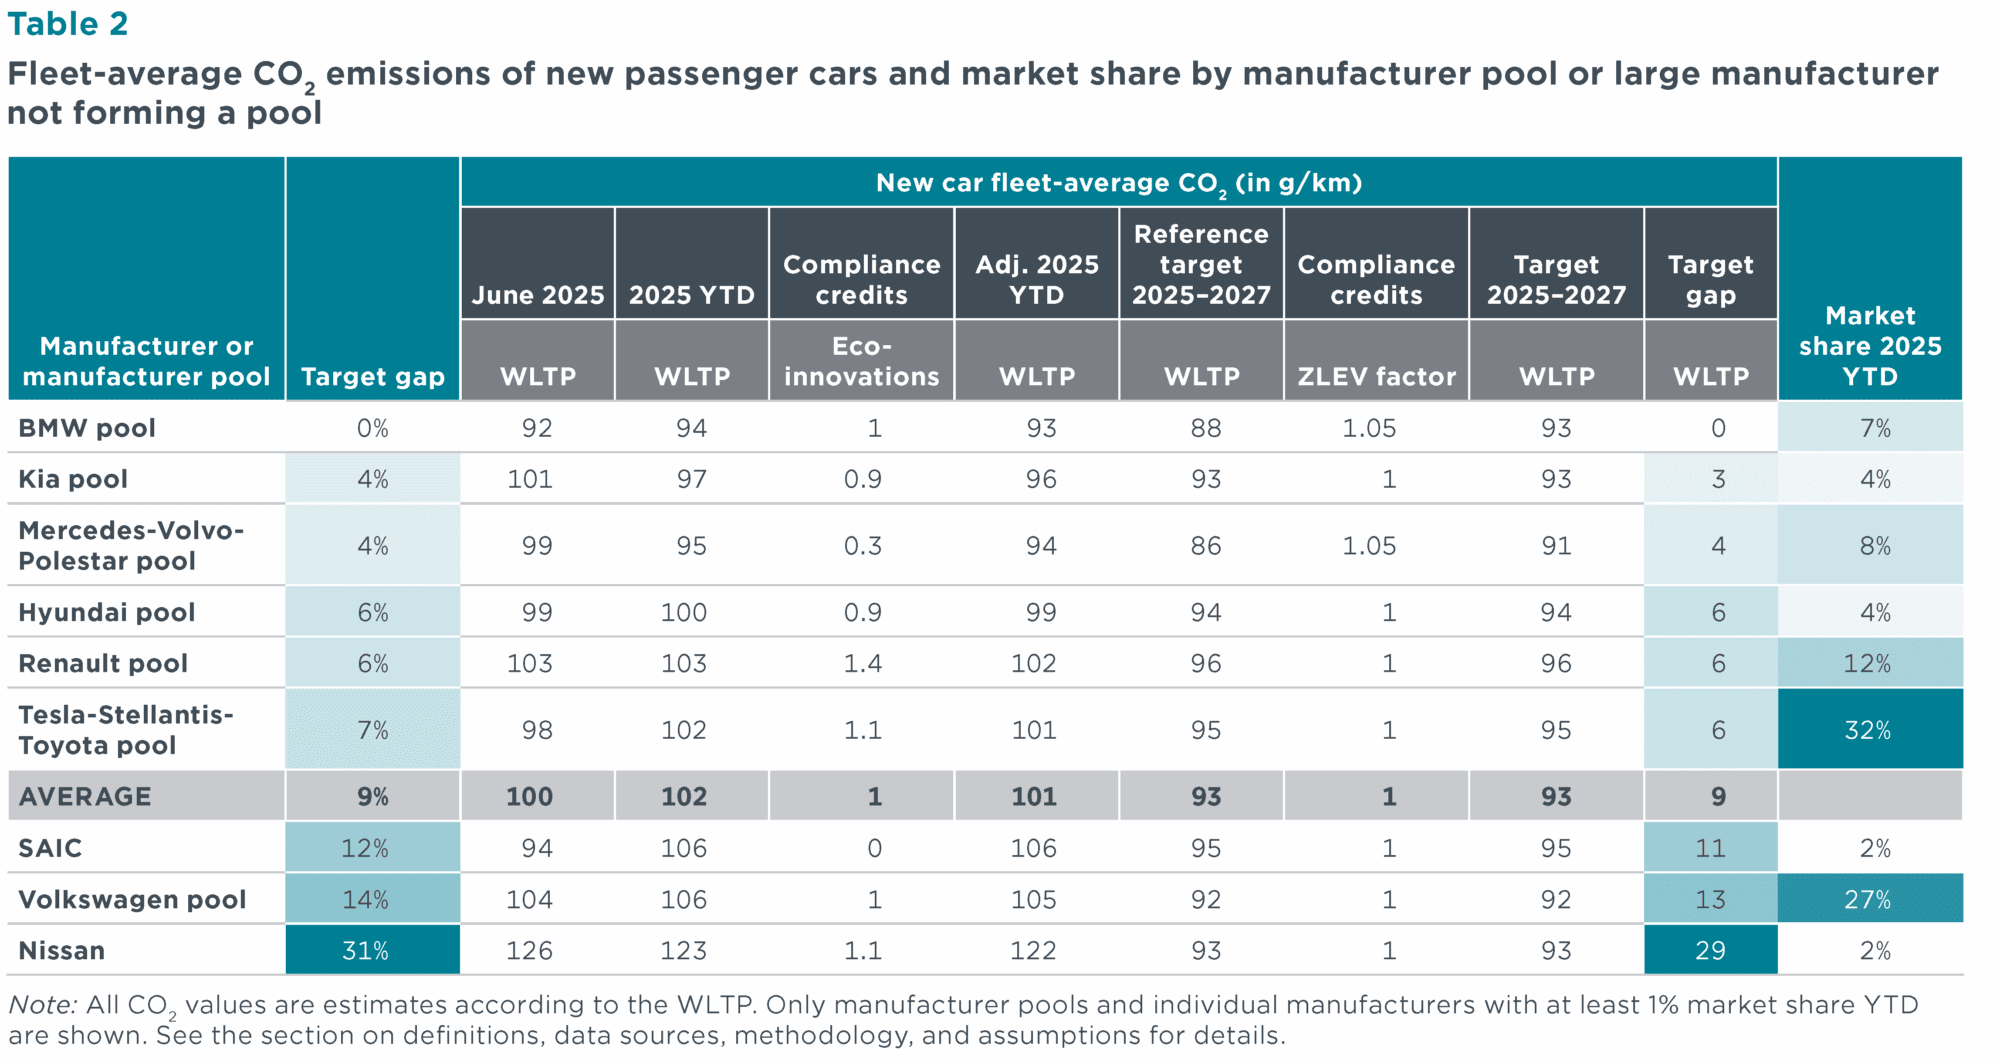
Table 3. Fleet-average CO2 emissions of new passenger cars and market share by manufacturer group and brand

Passenger car registrations by country

Looking at the major European markets, total passenger car registrations in Spain grew 14% in H1 2025 compared with the same period in 2024, while registrations decreased in Belgium (-11%), France (-8%), Germany (-5%), and Italy (-4%). Focusing on the largest markets by combined new BEV and PHEV registrations, Norway (96%), Denmark (66%), Sweden (60%), and the Netherlands (55%) all had combined shares above 50%, and Belgium (41%), Austria (31%), and Germany (28%) also recorded combined BEV and PHEV market shares above the average for Europe. Among the largest markets by total new passenger car registrations, the highest growth in BEV registrations occurred in Spain, Czechia, and Poland, where they increased 83%, 66%, and 61%, respectively, in H1 2025 compared with H1 2024. Registrations in France dropped 6% during the same period. BEV registrations in the largest European market of Germany continued to rise, with a 35% increase in BEV registrations in H1 2025 compared with H1 2024 and over 47,000 BEVs were registered in June alone. Registrations of PHEVs increased the most in Spain (+84%) and Poland (+81%) in H1 2025 compared with H1 2024 and HEV registrations increased the most in Austria (+31%) and Spain (+30%). Shares of MHEVs were highest in Italy (31%) and Poland (28%) in H1 2025, and they are gaining popularity in France, where registrations increased 52% in H1 2025 compared with the same period in 2024.

Figure 3. Share of plug-in hybrid and battery electric passenger cars by country, including information on market size (total new car registrations)

Note: The figure highlights the 10 largest markets by new BEV and PHEV registrations YTD. The “Other” category includes all remaining EEA countries not individually highlighted, except for Bulgaria, Liechtenstein, and Malta. Data for Sweden covers January to May 2025 only. The same applies to Cyprus, Latvia, Lithuania, and Portugal, all categorized under “Other.”
Table 4. New passenger car registrations by country

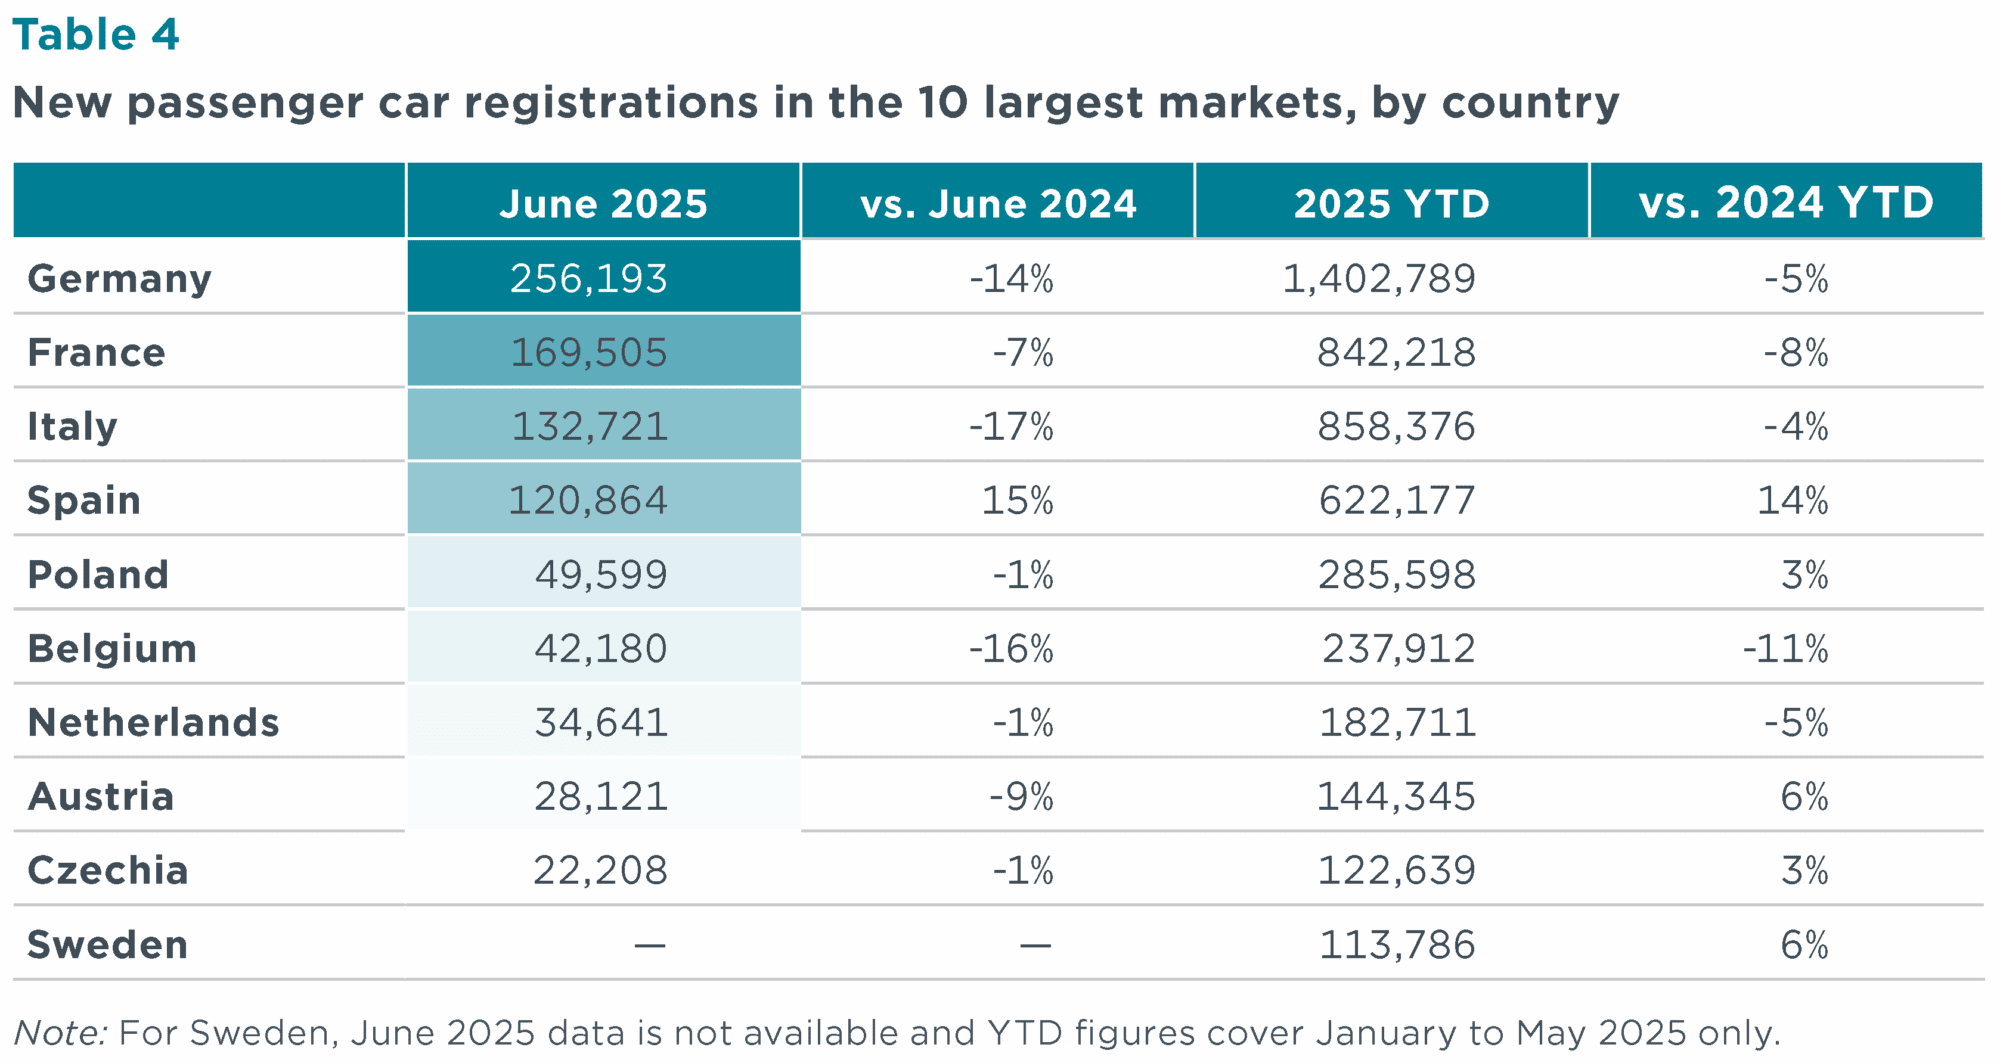
Table 5. New battery electric, plug-in hybrid, hybrid, and mild hybrid passenger car registrations by country

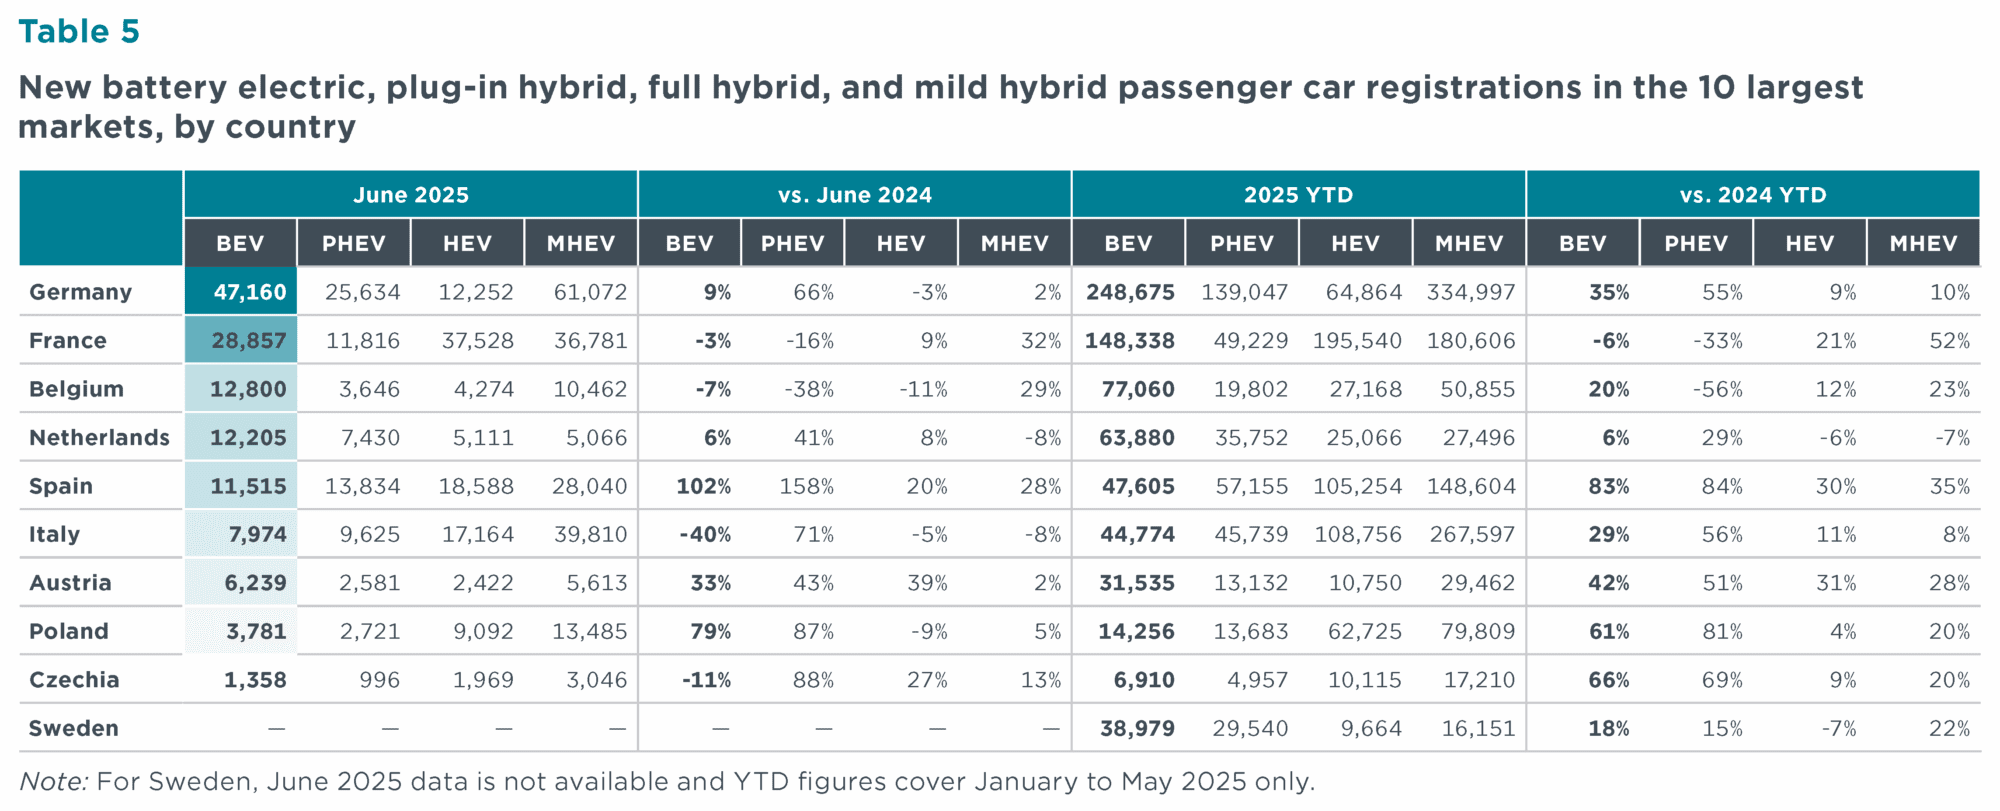
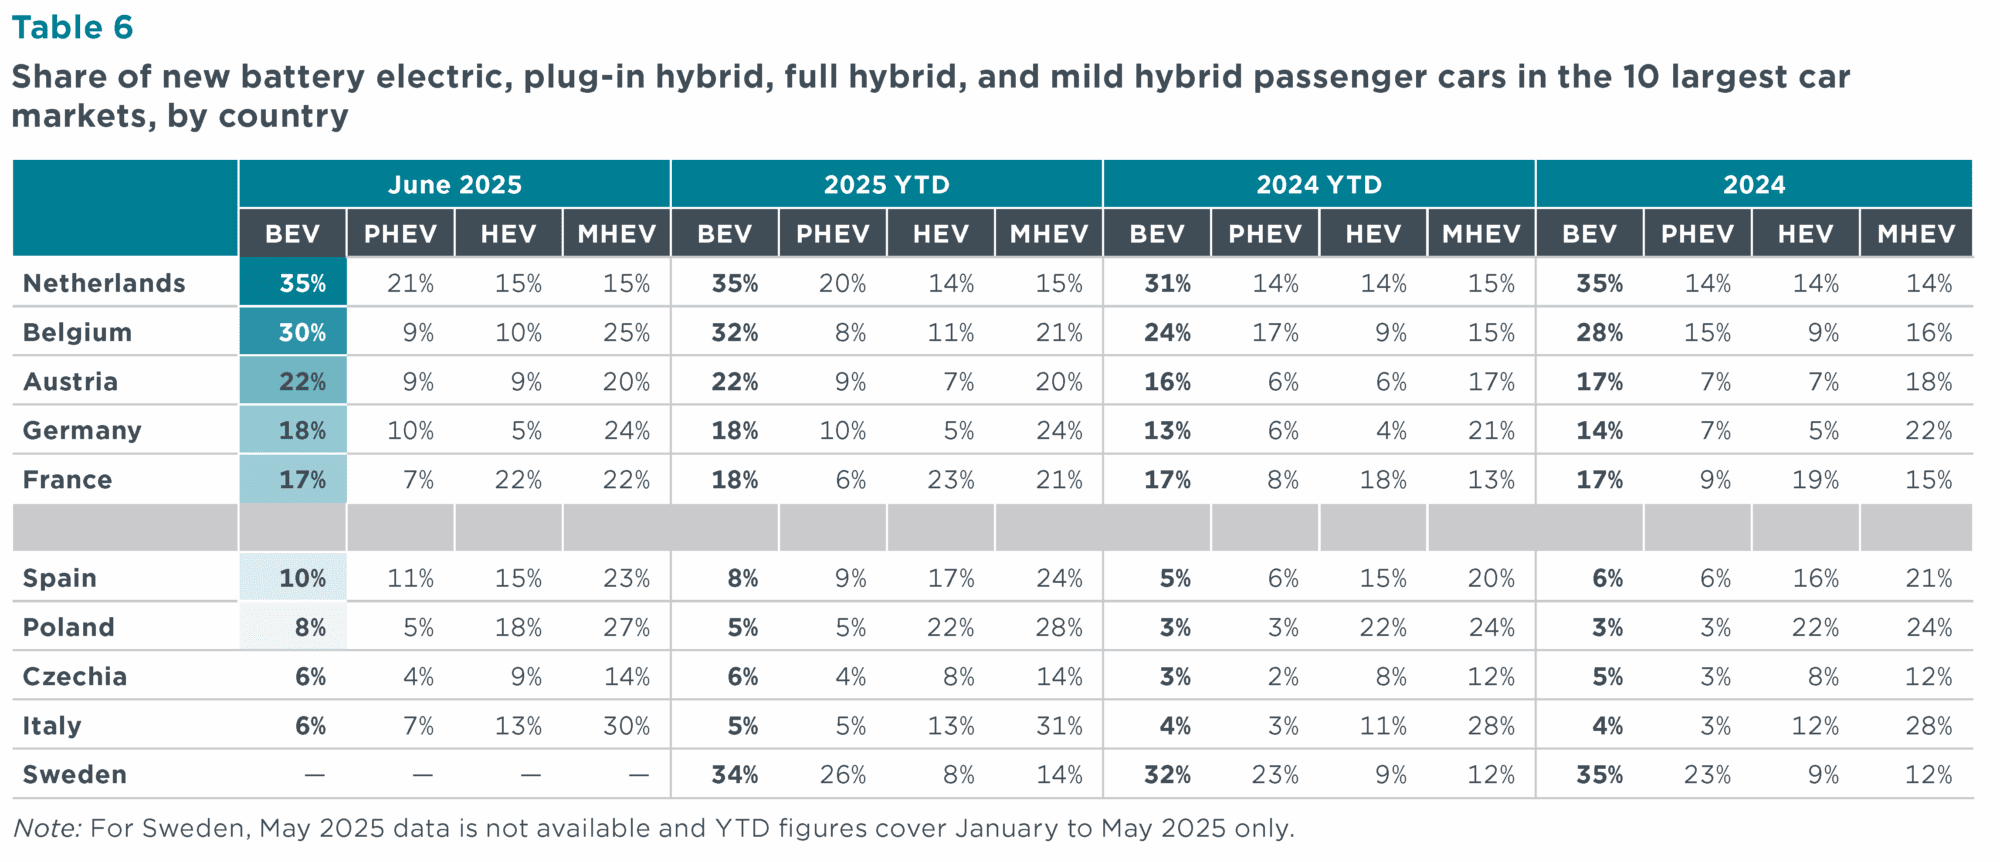
Table 6. Share of new battery electric, plug-in hybrid, full hybrid, and mild hybrid passenger cars by country

Passenger car registrations by owner

Corporate fleets, comprised of company fleets (34%), car dealers and manufacturers (15%), and short-term rentals (14%), made up 63% of the total registrations in April and May 2025, while private cars made up 37% of the market. Short-term rental registrations appear to fluctuate more than other owner types; they ranged from nearly 14% of sales in April and May 2025 to only 6% in the third quarter (Q3) 2024. In April and May 2025, the split of new registrations by owner type largely mirrored that of Q2 2024.

Figure 4. New passenger car registrations by owner for 19 select European countries

Van registrations

New van registrations declined in Germany (-15%), France (-12%), and Italy (-12%) in H1 2025 compared with the same period in 2024, and registrations in Spain grew by 7% compared with H1 2024. Of newly registered vans, 9% were battery electric in H1 2025, compared with 6% in H1 2024. Nissan (14%), Toyota (12%), the Volkswagen pool (11%), and the Renault pool (9%) all had BEV shares at or above the European average, while the Mercedes-Benz (8%), Stellantis (8%), and Ford (5%) pools and Iveco (1%) remained below the average. Shares of battery electric vans increased the most in Italy, rising 3 percentage points to 5% in H1 2025 compared with the same period in 2024. Looking at manufacturers and pools, the average target gap decreased slightly to 17 g CO2/km after Q2 2025. Ford notably reduced its target gap by 6 g CO2/km in Q2 2025, while Iveco and the Mercedes-Benz pool are currently the farthest from their 2025 CO2 targets, with target gaps of 37 and 31 g CO2/km, respectively.
Table 7. Share of battery electric, plug-in hybrid, full hybrid, and mild hybrid vans by manufacturer pool or large manufacturer not forming a pool

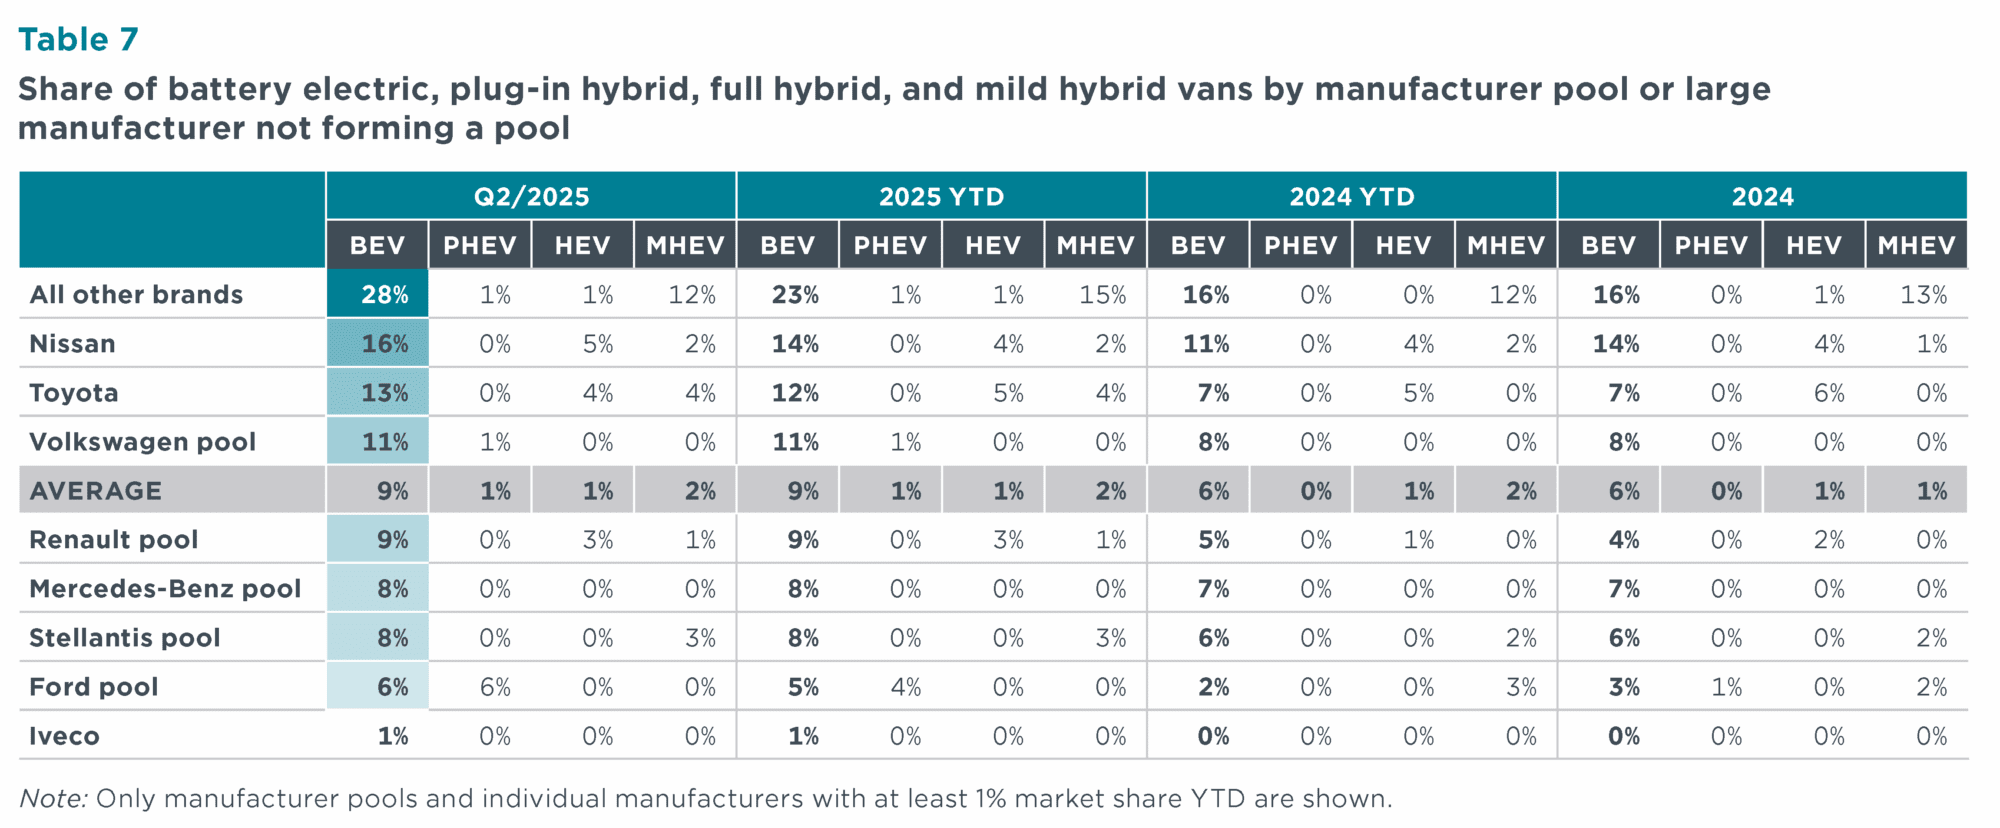
Table 8 . Fleet-average CO2 emissions of new vans and market share by manufacturer pool or large manufacturer not forming a pool

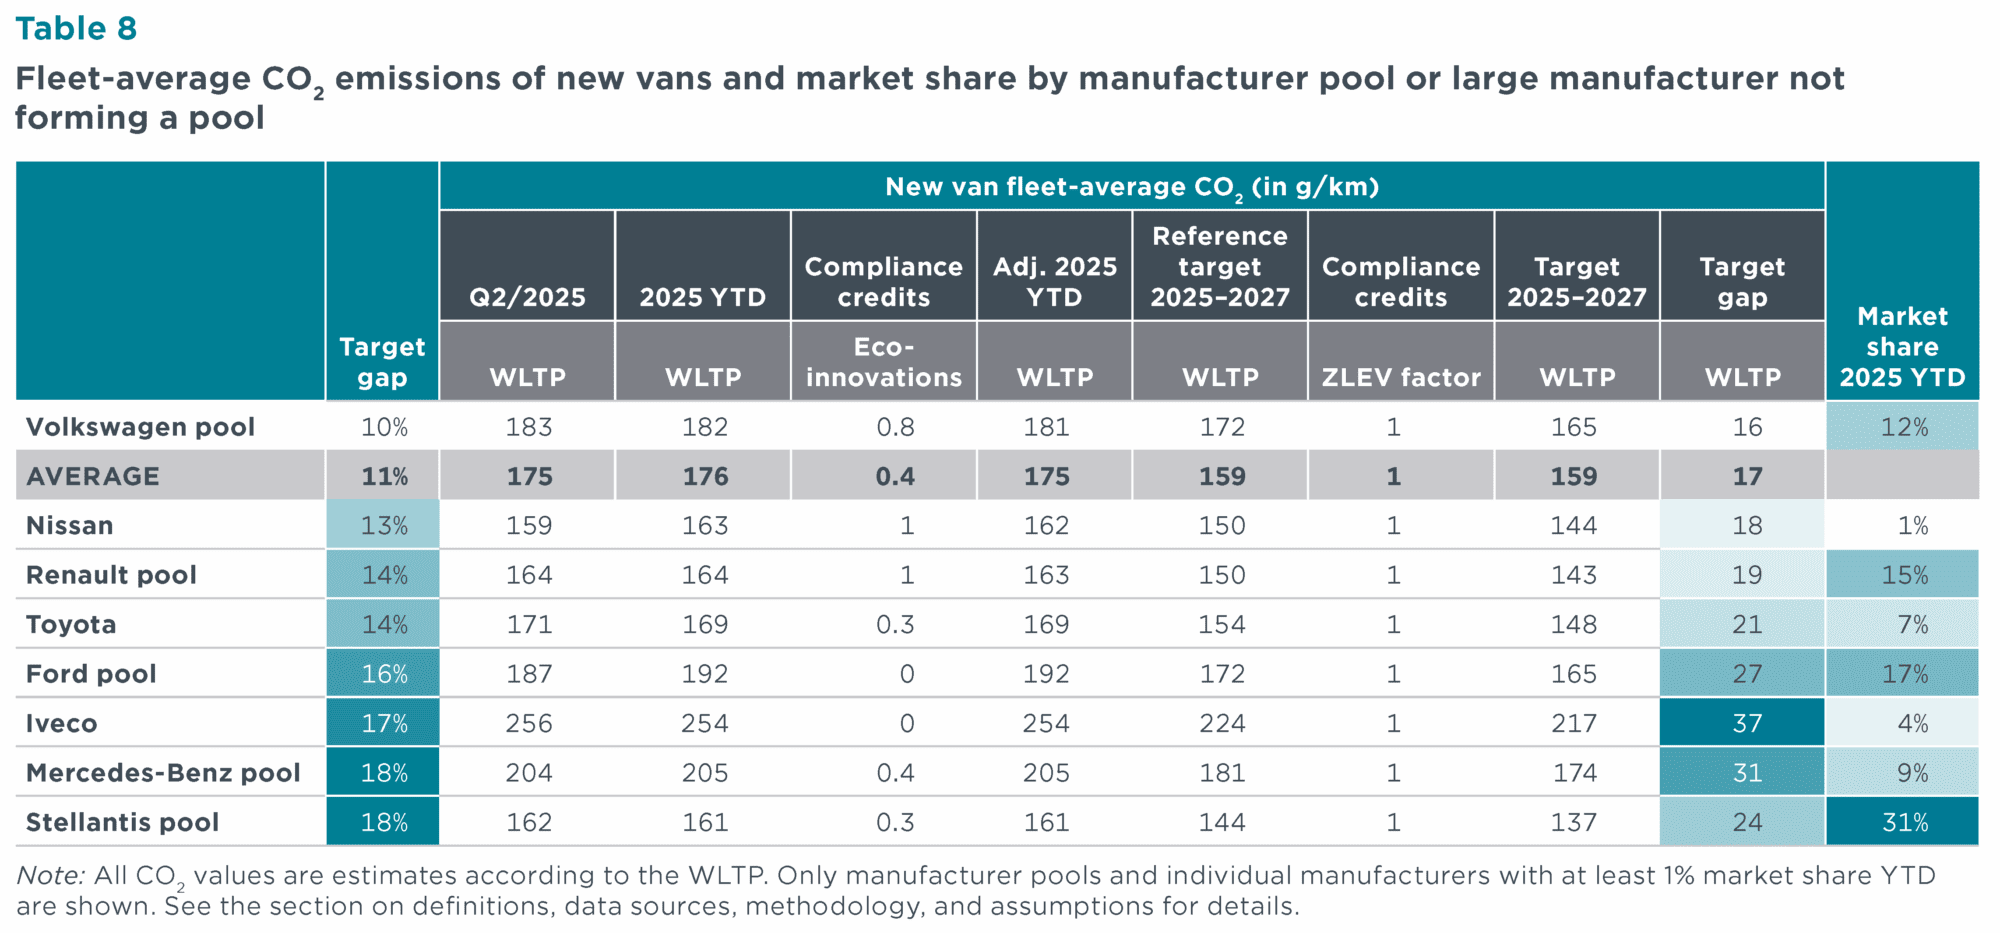
Table 9. New van registrations by country, for the four largest European markets

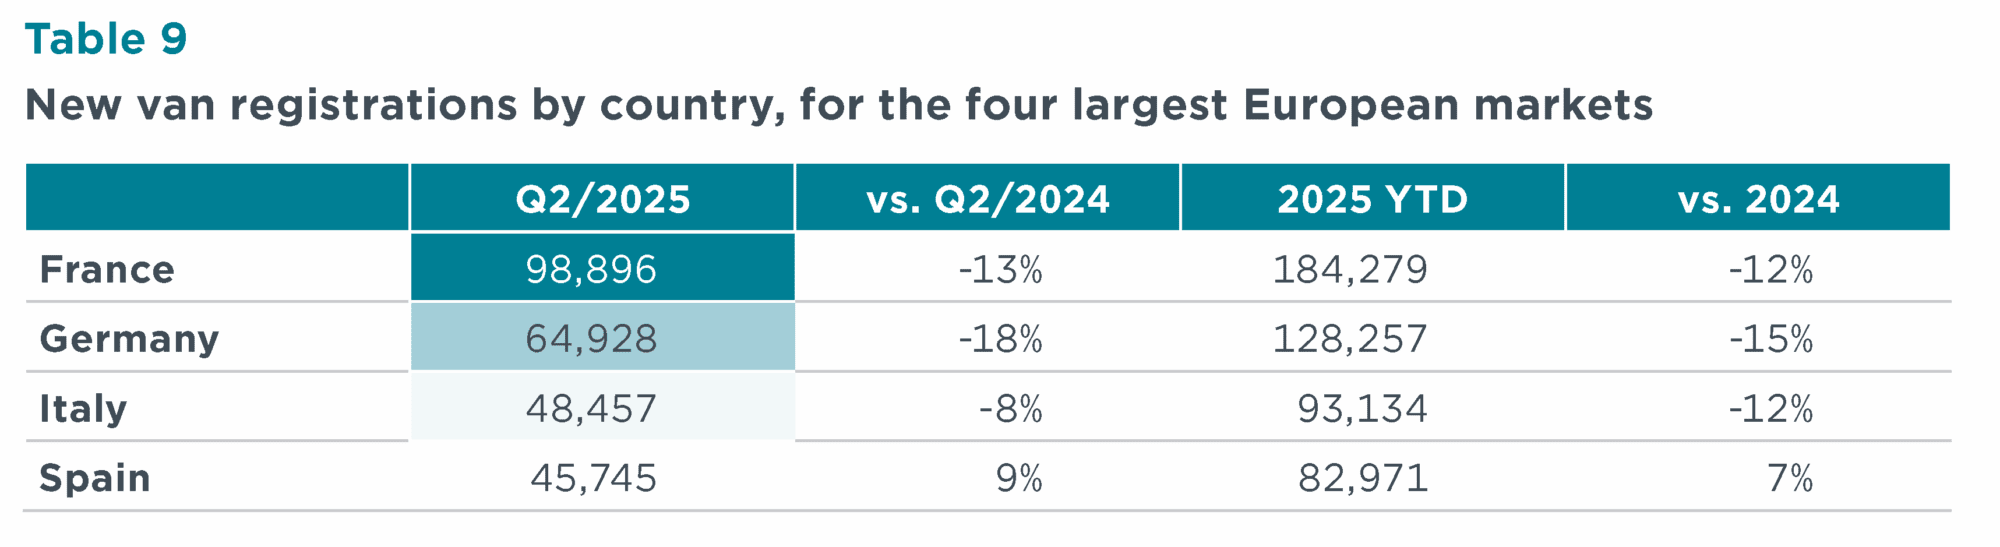
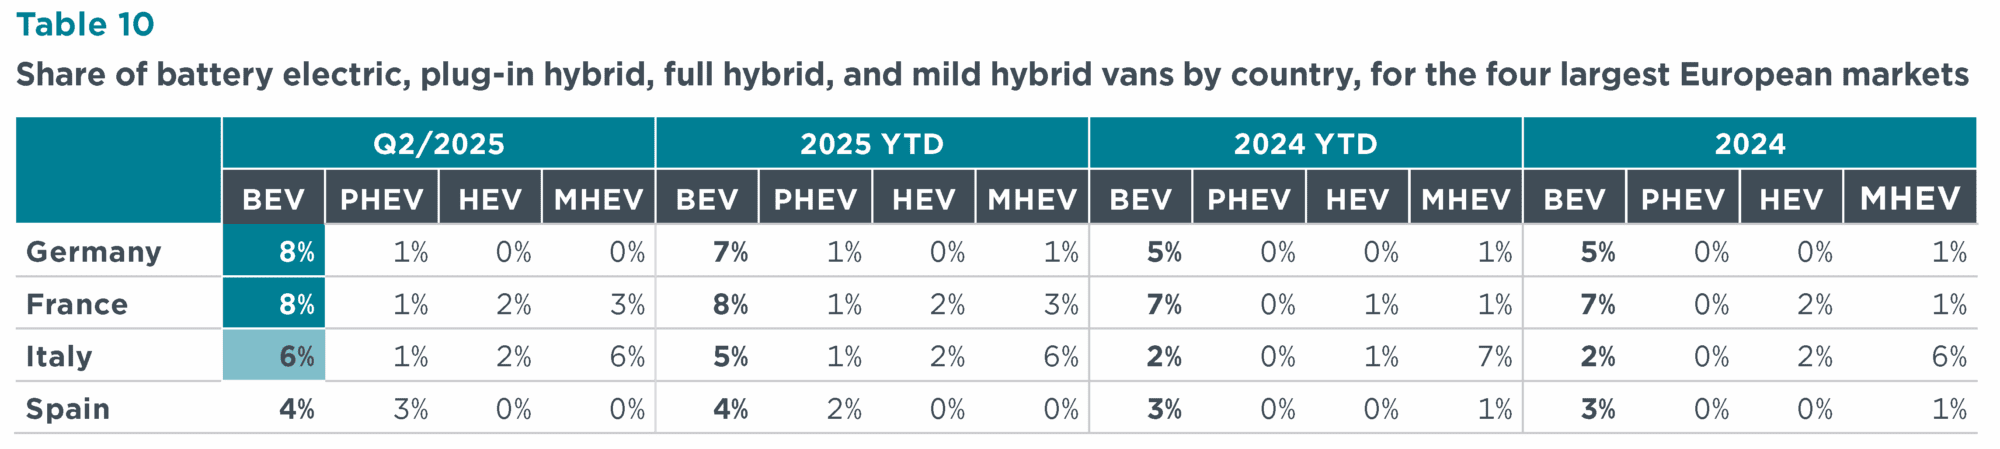
Table 10. Share of battery electric, plug-in hybrid, full hybrid, and mild hybrid vans by country, for the four largest European markets

Spotlight: Charging infrastructure development

More than 1.05 million public charging points were installed in Europe by the end of Q2 2025, up from around 1 million at the end of Q1 2025. For alternating current (AC) charging, this is a 22% increase over the same point in 2024. Direct current (DC) charging points showed even greater growth, increasing 41% compared with the end of Q2 2024. Approximately 81% of Europe’s public charging points supply AC and the remaining 19% supply DC. Denmark recorded the largest growth in terms of both AC (+50%) and DC (+79%) chargers by the end of Q2 2025 compared with 2024, and DC charging points also increased substantially in Italy (+62%) and Belgium and Austria, both +59%. On average, there were about 7.5 22 kW-equivalent publicly accessible charging points installed per thousand passenger cars and vans on the road in Europe at the end of June 2025, up from 7.2 at the end of March 2025. With over 46 22 kW-equivalent publicly accessible charging points per thousand passenger cars and vans, Norway continues to lead Europe in charging infrastructure, and is followed by Iceland (39), Denmark (34), and Sweden (25). Along with increasing BEV shares of new vehicle registrations, charging infrastructure in Italy (3) and Spain (3) is increasing at a pace at or above the European average for publicly accessible charging points.

Figure 5. 22 kW-equivalent publicly accessible charging points installed per thousand passenger cars and vans, by type of power output and country by the end of June 2025

Note: The width of the bars provides information on passenger car and van stock size estimates as of the end of 2024. 22 kW-equivalent is used to account for different power outputs while allowing for comparison among countries.
Table 11. Number of publicly accessible charging points installed, by country and type of power output

This publication is a collaboration between the ICCT, IMT-IDDRI, and ECCO think tank.

Privacy Overview
International Council on Clean Transportation

This website uses cookies to enable some basic functionality and also to help us understand how visitors use the site, so that we can improve it.

Essential Cookies

Essential cookies provide basic core functionality, such as saving user preferences. You can disable these cookies in your browser settings.

Analytics

We use Google Analytics to collect anonymous information about how visitors interact with this website and the information we provide here, so that we can improve both over the long run. For more on how we use this information please see our privacy policy.