Update on electric vehicle costs in the United States through 2030
White paper
Assessment of light-duty electric vehicle costs and consumer benefits in the United States in the 2022–2035 time frame
This paper analyzes bottom-up vehicle component-level costs to assess average battery electric vehicle (BEV), plug-in hybrid vehicle (PHEV), and conventional vehicle prices across major U.S. light-duty vehicle classes through 2035. These cost estimates are used to evaluate broader consumer benefits, as well as to discuss the implications for vehicle emission regulations in the United States.
The analysis finds that price parity with convention vehicles will occur between 2024 and 2026 for 150- to 200-mile range BEVs, between 2027 and 2029 for 250- to 300-mile range BEVs, and between 2029 and 2033 for 350- to 400-mile range BEVs. Pack-level battery costs, which have a key impact on price parity timing, are expected to decline to about $105/kWh by 2025 and $74/kWh by 2030 due to technological advancements and increased production volumes. Increasing the annual battery cost reduction from 7% to 9% typically accelerates the timing for parity by about 1 to 2 years, while decreasing the annual battery cost reduction from 7% to 3% typically delays parity by about 1 to 4 years.
The analysis also finds that, by 2025, BEVs with up to 300 miles of range have a six-year cost of ownership that is less than comparable gasoline models in every light-duty vehicle class. PHEVs with 50 miles of electric range approach first-owner cost of ownership parity with conventional vehicles by 2030, but their 2030 six-year ownership costs are $7,500 to $11,300 greater than those of 300-mile range BEVs.
The upfront costs of transitioning to BEVs are greatest in 2022 at about $4.5 billion, when BEVs’ upfront incremental price is the greatest, and the net consumer benefits outweigh the costs beginning in 2024. The annual net present value of consumer benefits surpasses $18 billion by 2027 and reaches about $70 billion by 2030. Capturing these benefits will require continued BEV market growth to about 2 million annual sales by 2025 and about 8 million annual sales by 2030.
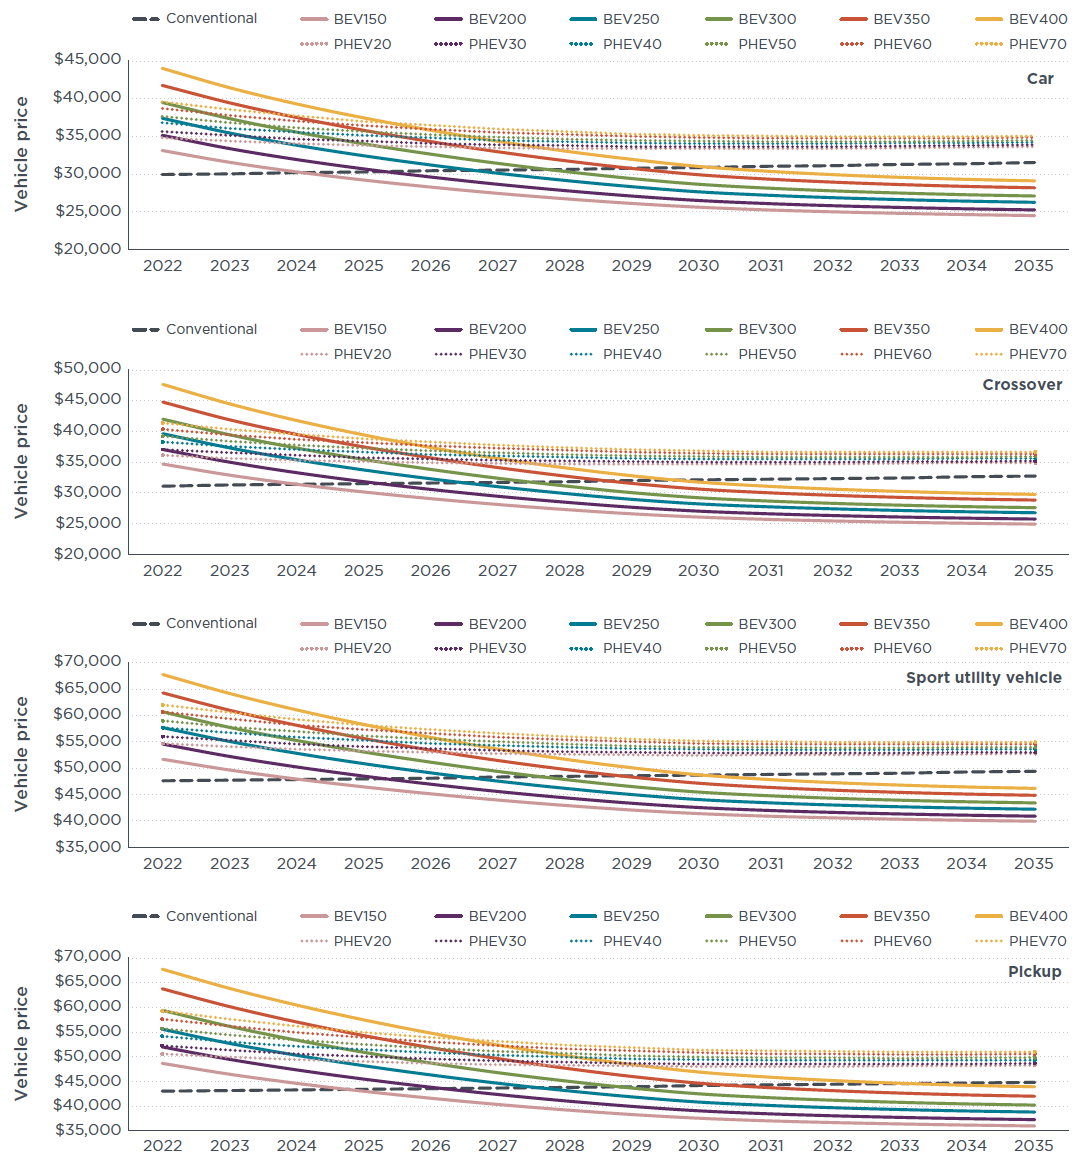
Figure ES1. Conventional, battery electric, and plug-in hybrid electric vehicle prices of cars,
crossovers, sport utility vehicles, and pickups in the United States for 2022–2035.