Briefing
Great Lakes-St. Lawrence Seaway ship emissions inventory, 2019
This paper presents a new, wide-ranging inventory of emissions and fuel consumption for ships operating in the Great Lakes-St. Lawrence Seaway (GL-SLS) in 2019. Using the Systematic Assessment of Vessel Emissions (SAVE) model developed by ICCT, the authors estimated fuel use and emissions based on satellite and terrestrial Automatic Identification System (AIS) data from exactEarth and ship characteristics from IHS Markit. Details of CO2 emissions and fuel consumption are included in the briefing paper, and emissions of other air and climate pollutants, including methane (CH4), black carbon (BC), sulfur oxides (SOx), nitrogen oxides (NOx), particulate matter (PM10 and PM2.5), and more are included in a supplemental statistics file attached at the bottom of this page.
The analysis shows that ships in the GL-SLS consumed more than 500,000 tonnes of fuel in 2019 and that led to approximately 1.6 million tonnes (Mt) of CO2 emissions, about two-thirds of which were emitted in U.S. waters. Of the fuel consumed, 83% was low-sulfur distillate fuel, 15% was high-sulfur residual fuel used by ships with scrubbers, and 2% was liquefied natural gas. Bulk carriers were responsible for about 62% of the CO2 emissions in 2019, and U.S.- and Canada-flagged vessels emitted 80% of the CO2 emissions, split roughly evenly between the two. This work can be used by a variety of stakeholders as a baseline to understand the potential benefits of developing policies, action plans, and roadmaps that can improve the environmental performance of the GL-SLS maritime transportation sector. We intend to periodically update this analysis with results for other years, as data and resources allow.
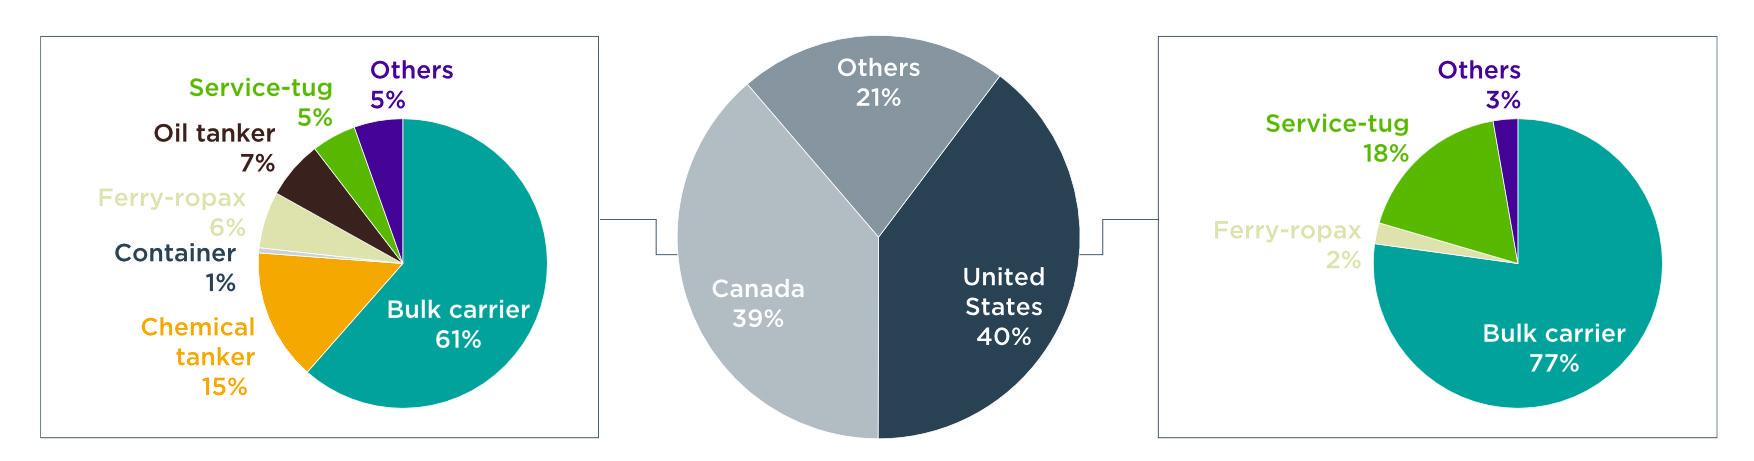
Figure. Share of CO2 emissions from U.S.- and Canada-flagged vessels in the GL-SLS, 2019.
Attachments
Appendix C – Supplemental statistics
Appendix D – Map files