STACKS

US passenger vehicle CAFE and GHG regulations: The basics

  1. Why are there two different regulations governing the same thing, passenger vehicle fuel efficiency?
  2. What do the regulations do?
  3. How are fuel economy and GHG emission targets set?
  4. Why do the target values seem so high?
  5. How do manufacturers meet the standards?
  6. What effects have the regulations had?
  7. What do the regulations cost?
  8. Sources and credits

US federal passenger vehicle efficiency standards are set through two regulations, issued by the National Highway Traffic Safety Administration and the Environmental Protection Agency. In addition, regulations by the Californias Air Resources Board affect about a third of the U.S. fleet, and they have typically preceded federal action. These policies are in the political spotlight now and will remain there for a while.

These standards have been a key element of US energy and climate policy, and they exert a significant influence on the pace and direction of technology innovation in the auto industry. In some cases, the policy arguments over these regulations reflect misunderstandings about what they do and how they work.

This stack is a quick explainer on some of the more important elements.

Start
  • Why are there two different regulations governing the same thing, passenger vehicle fuel efficiency?

    The US corporate average fuel economy (CAFE) standards were originally set out in the Energy Policy and Conservation Act of 1975, but they fundamentally trace back to the 1973 oil embargo by the Organization of Petroleum Exporting Countries (OPEC). The goals of the first CAFE standards were to reduce oil imports, limit the country’s economic vulnerability to OPEC, and improve national security. That set of background aims has remained part of the basic rationale of CAFE throughout its history. It’s not coincidence that when Congress moved to update the fuel economy regulations in 2007, for the first time in two decades, it did so in a piece of legislation named the Energy Independence and Security Act.

    By making the US passenger vehicle fleet more fuel efficient, the CAFE program inherently reduces emissions of carbon dioxide, the most important greenhouse gas (GHG). However, the CAFE regulations do not directly target CO2, not to mention other GHGs or, for that matter, “conventional” pollutants, such as nitrogen oxides (NOx) or particulate matter, which also have climate effects. Carbon dioxide emissions from vehicles, and other GHGs, are regulated under the Clean Air Act by the EPA. That regulation traces back to the 2007 US Supreme Court decision in Massachusetts v Environmental Protection Agency, in which the court held that the Clean Air Act gives the EPA authority to regulate tailpipe emissions of GHGs, and in fact requires it to do so if they endanger public health and welfare, because those gases fit the CAA’s definition of air pollutants.

    Limiting vehicle GHG emissions and limiting fuel consumption are closely linked, because CO2 is directly proportional to fuel consumption: burn one gallon of gasoline and you will release about 9 kg (20 lbs) of CO2; burn a gallon of diesel and it’ll be about 10 kg (22 lbs) CO2. However, that observation greatly simplifies things. The actual greenhouse gas emission standards regulate CO2, methane (CH4), nitrous oxide (N2O), and air-conditioning refrigerants (typically R-134a). In addition, the increasing presence of alternative-fuel vehicles, like electric vehicles, in the national vehicle fleet further complicates the link between between carbon emissions and fuel economy.

    That fuel-to-carbon link made it possible for NHTSA and EPA to develop standards jointly, which they’ve done since 2010 (for standards affecting cars and light-duty trucks MY 2012 and beyond). But EPA has assisted NHTSA on the CAFE regulation since the beginning, because EPA was always required to test vehicle fuel economy (and report to NHTSA) and conduct enforcement of the testing requirements. The coordinated effort (which includes California as well as the federal agencies) ensures that automakers can develop a single fleet of vehicles to comply with all relevant regulations nationwide.

    But the different histories, and different aims, of the regulations have resulted in some differences between them—e.g., in the credits they offer for certain technologies, and in the time frames over which they can operate and regulate.

  • What do the regulations do?

    In the simplest terms, their basic function is to define annual corporate average standards, or targets, for fuel economy (in miles per gallon) and CO2 emissions (in grams of CO2 per mile) for passenger cars and light trucks. Elaborated a bit:

    • They define how an individual corporate standard, or target, will be determined for every auto manufacturer, for every year that the regulation applies. (The current CAFE regulation covers the years 2016–2021; the GHG regulation covers 2016–2025.)
    • They define a baseline and an annual rate of improvement in fuel efficiency, by type and size, for all vehicles sold in the U.S.
    • They define means by which manufacturers can meet their annual targets — means that aren’t strictly limited to making all their vehicles more fuel-efficient that year.

    A key feature of the corporate standard is that it depends on the average size of a manufacturer’s fleet, and on the mix of cars and light trucks it sells. Average size and model mix differs for every automaker; it follows that every automaker’s fuel economy (or GHG) target differs from every other automakers’. Average size and model mix also changes from year to year, in response to changing consumer preferences, so every automaker’s corporate average target is determined annually based on teh mix of vehicles it actually produces. GM’s MY 2021 GHG target, for example, was not set back in 2012 when the regulation applying to MY 2017–2025 was finalized.

    Another key feature: the corporate standard applies to the average efficiency of all the cars and light trucks a manufacturer sells in a year. That is, the regulations are designed around an assumption that every automaker will sell some models that are relatively more fuel-efficient than the target for that type and size vehicle, and some that are relatively less efficient.

    One thing the current version of the CAFE/GHG regulations don’t do is set a target for the U.S. light-duty fleet as a whole. It can be a useful simplification to talk about “the” fuel economy standard, as in 54.5 mpg in 2025, but in fact that number was not a target but a prediction based on two things: the fuel efficiency that would be required in 2025 for every individual type of car and truck—i.e., a known mpg value; and the number and mix of cars and trucks of varying sizes that each individual manufacturer would build and sell, which was unknown—a projection. The original fleet-wide average 54.5 mpg in 2025 was predicted in the 2012 rulemaking, under the assumption that the fleet mix in 2025 would be the same as in 2012. In 2016, the prediction was recalculated, using updated information on the US fleet and technology potentials. The new prediction is a fleet-wide average 51.4 mpg in 2025. Again, this is not a legal requirement in any way, but simply an estimate of where we might be by 2025 using the current regulations. The actual fleet average may be higher or lower in 2025.

    In summary, the current regulations are designed to do two things: force all types of light-duty vehicles to become more fuel-efficient every year, and avoid forcing automakers to sell a particular mix of vehicles. To illustrate: Under the regulations, it would be theoretically possible for a manufacturer to go from selling mainly small, highly fuel-efficient cars, and consequently having a high CAFE standard, to selling mostly big, relatively gas-guzzling SUVs and trucks, and still meet its targets because its corporate average standard would be much lower.

  • How are fuel economy and GHG emission targets set?

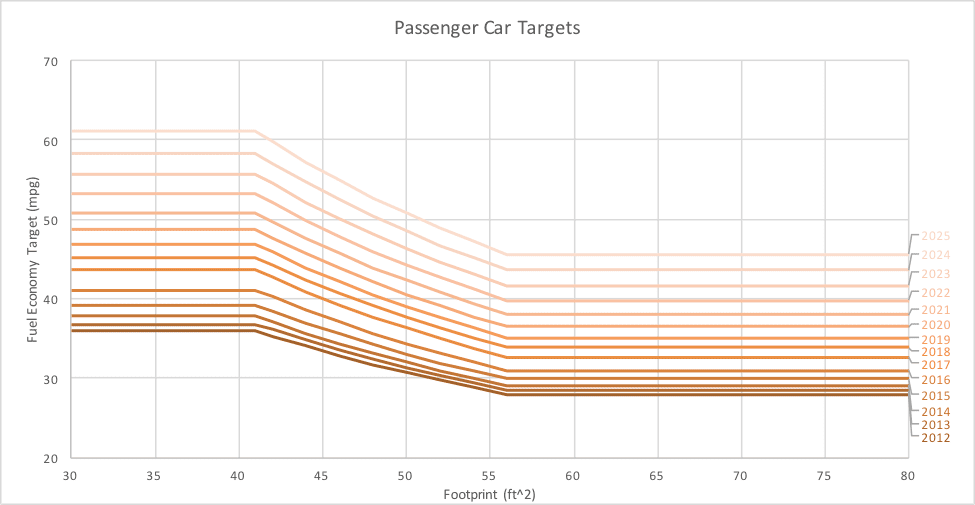
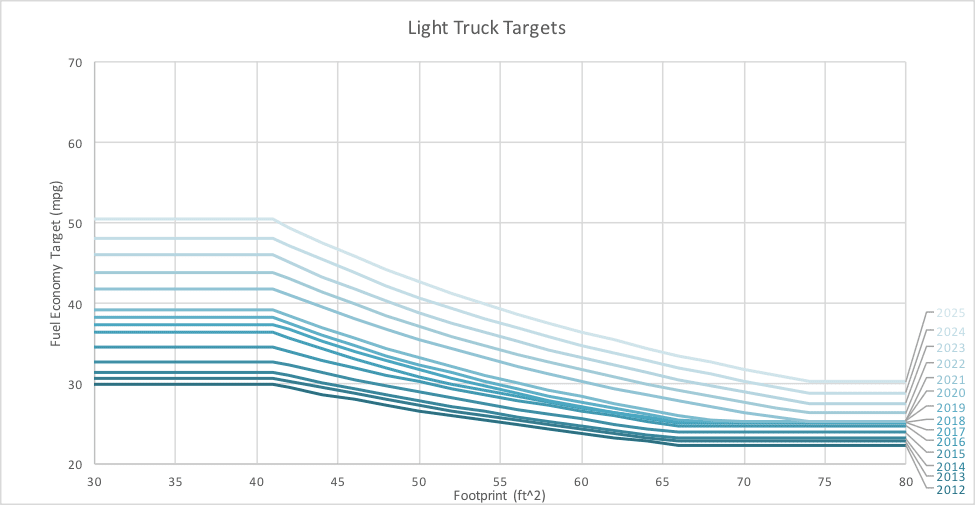
    Fuel economy targets are determined for individual car and light truck models according to size, as defined by vehicle “footprint”: the area inside the four wheels, or the wheelbase multiplied by the track width. A baseline was established in 2012, and the EPA’s GHG regulation defines required annual rates of improvement through 2025. (The CAFE regulation only runs through 2021; the required annual rates of improvement are the same until that point.) Cars and light trucks have different targets, and different mandated rates of improvement. The two charts below illustrate.

    chart - US passenger car targets 2012-2025

    chart - US light truck targets 2012-2025

    So, in the baseline year 2012, a car with a vehicle footprint of 50 sq. ft. had a fuel economy target of about 30 mpg, and the same size car in 2025 will have a fuel economy target of a bit over 50 mpg. A pickup truck with the same 50 sq. ft. vehicle footprint had a target of about 26 mpg in 2012, which rises to over 40 mpg in 2025.

    These targets are grounded in NHTSA’s and EPA’s joint assessment of vehicle technology development potential, feasibility, and costs, which provides a basis for determining an annual rate of improvement that’s attainable, but not too easy. The agencies carried out an initial technology assessment in 2010–2011, and released a follow-up study in 2016, to test the validity of the projections made five years earlier.

    Each manufacturer will generate two sales-weighted averages.  One is the average of the target value for each vehicle, based upon that vehicle’s footprint and car/light truck classification.  The second is the average of the actual measured fuel consumption or CO2 from the same vehicles. A simple way to illustrate this is to use fuel consumption—gallons per 100 miles—because that directly captures the energy efficiency and CO2 emissions of all vehicles over the same distance, and it’s a simple conversion to miles per gallon. Since a vehicle uses the energy in its fuel to travel a certain distance, the standards are set based on this relationship, and made more stringent by requiring more energy-efficient vehicles over time. The “average” fuel efficiency is thus a simple sales-weighted average of the energy efficiency of all the vehicles sold by a manufacturer. The inverse of this average fuel efficiency (in gallons per mile or per 100 miles) is exactly the fuel economy (in miles per gallon). In the US, where mpg ratings are the norm, another (and more common) method is to use the harmonic mean of fuel economy (mpg). The result is the same.

    Imagine a Manufacturer X, which sells 9 vehicle models in a given model year:

    Carline Footprint (ft^2) Target (mpg) Target (gal/100-mi) Sales volume
    Car A 42.4 35.01 2.86 1500
    Car B 42.2 35.14 2.85 2000
    Car C 42.3 35.08 2.85 2000
    Car D 42.5 35.95 2.78 1000
    Car E 41.2 35.81 2.79 3000
    Car F 50.7 30.33 3.30 8000
    Car G 51.4 29.99 3.33 2000
    Car H 52.4 29.52 3.39 5000
    Car I 51.9 29.76 3.36 3000
    Total 27,500

    Manufacturer X’s target, then, is:

    [ (2.86×1500) + (2.85×2000) + (2.85×2000) + (2.78×1000) + (2.79×3000) + (3.30×8000) + (3.33×2000) + (3.39×5000) + (3.36×3000) ] ÷ 27500
    = 3.16 gal/100-mi
    = 31.6 mpg


  • Why do the target values seem so high?

    At first glance, the fuel economy levels set by the standards seem high—very high. Consider the example above: in 2012 very few non-electric or non-hybrid cars with a footprint of 50 sq. ft. claimed to get 30 mpg or more on the window sticker, or label, that every car on a dealer’s lot displays. The reason for this discrepancy is that the targets set by the standards are not the same as that label fuel economy value. Rather, they are an initial estimate of fuel economy based on standardized laboratory testing conducted by the EPA.

    This testing comprises two drive cycles in a controlled setting, and measures vehicle emissions and fuel, or energy, consumption (generally in units of gallons per mile or gallons per 100 miles). The city, or urban, driving test is mainly low speed, and includes many stops and starts. The highway test, on the other hand, is conducted at sustained, higher speeds. Combining the city fuel consumption result, weighted at 55%, with the highway fuel consumption at 45%, results in an overall, or “combined,” fuel consumption value. The mathematical inverse of fuel consumption is fuel economy. It is this two-cycle, combined value that each manufacturer must demonstrate meets the target.

    The benefit of this scheme is that it’s good for comparing all vehicles equally, and repeatably. But the two test cycles don’t really come very close to capturing the wide variety of real-world driving or, consequently, real-world fuel economy—which is what those window stickers are supposed to reflect. Many factors affect the fuel/energy efficiency of vehicles in the real world, and no standardized test will perfectly estimate fuel economy for all drivers.

    To give consumers a more accurate fuel economy estimate, the EPA conducts three other tests, which, when combined with the first two, lead to a new, 5-cycle, test result for each vehicle. It is the new 5-cycle adjusted fuel economy that we see on car and truck fuel economy labels. This adjusted fuel economy, as it’s also known, is lower than the fuel economy targets, and represents a more realistic estimate of real-world driving fuel economy. The additional tests take into account factors like cold start, air-conditioning usage, and different periods of high-speed and low-speed driving, stopping, and acceleration. Again, the results don’t perfectly represent the real world, but they are closer than the simpler two-cycle estimates used to certify vehicles against the standards. In fact, evidence suggests that the more fuel efficient a vehicle is, the greater the gap between two-cycle fuel economy, label (or adjusted) fuel economy, and actual, real-world fuel economy.

    Testing all vehicles on these five test cycles would be arduous. Consequently, the EPA offers manufacturers a way to derive some of their vehicles’ 5-cycle city and highway label fuel economies from the results of only the city and highway test cycles. The derivation is a simple linear relation whose input is the city or highway fuel consumption, and whose output is the derived 5-cycle city or highway fuel consumption. EPA calculated the slope and intercept of these linear relations using actual 5-cycle test results from hundreds of vehicles in 2011–2016.

    In summary, while adjusted fuel economy is more important to consumers, for practical purposes it doesn’t affect how manufacturers actually meet the CAFE and greenhouse gas standards.

  • How do manufacturers meet the standards?

    First and most obviously, by making their vehicles on average more efficient. Returning to Manufacturer X:

    Carline Footprint (ft^2) Target (mpg) Target (gal/100-mi) Measured fuel economy (mpg) Measured fuel consumption (gal/100-mi = 100/mpg) Sales volume
    Car A 42.4 35.01 2.86 34.0 2.94 1500
    Car B 42.2 35.14 2.85 34.6 2.89 2000
    Car C 42.3 35.08 2.85 33.8 2.96 2000
    Car D 42.5 35.95 2.78 34.4 2.91 1000
    Car E 41.2 35.81 2.79 32.9 3.04 3000
    Car F 50.7 30.33 3.30 32.2 3.11 8000
    Car G 51.4 29.99 3.33 33.1 3.02 2000
    Car H 52.4 29.52 3.39 30.6 3.27 5000
    Car I 51.9 29.76 3.36 28.5 3.51 3000
    Total 31.6 3.16 32.0 3.13 27,500

    Note that in some cases measured fuel consumption / fuel economy is better than the size-based standard requires for a specific vehicle, and in some cases, it’s worse. Manufacturer X’s overall standard, calculated above, is 31.6 mpg. However, its performance is:

    [ (2.94×1500) + (2.89×2000) + (2.96×2000) + (2.91×1000) + (3.04×3000) + (3.11×8000) + (3.02×2000) + (3.27×5000) + (3.51×3000) ] ÷ 27500
    = 3.13 gal/100-mi
    = 32 mpg

    Thus Manufacturer X over-complied for the specific model year with the sales in the table above. NHTSA makes manufacturer and fleet CAFE performance information publicly available.

    The primary way automakers improve average fuel-efficiency is through improved “conventional” power-train technologies and vehicle designs: innovative vehicle, engine, and transmission designs and controls. They are also gradually selling increasingly electrified vehicles, like hybrids, plug-in hybrids, and fully electric vehicles.

    Second, manufacturers are aided by credits for various technologies that reduce GHGs and improve efficiency but aren’t directly tested on EPA’s official test cycles for fuel economy. These credits that manufacturers apply to vehicles outside of the official, tested, drive cycles, are aptly called “off-cycle” credits. Other credits include “flex-fuel” vehicles (which can run on a hard-to-find mixture of 85% ethanol and 15% gasoline, or E85, as well as the typical 10% ethanol mixture, E10, sold in most gas stations), better air conditioners, and electric vehicles.

    Third, when manufacturers over-comply in a given model year (as Manufacturer X did), they generate another type of credit. These compliance credits are bankable—an automaker can earn credits in one year for use in later years—and tradeable—one automaker can sell credits to another. Manufacturer X performed 0.4mpg better than the standard. Thus, Manufacturer X generated 4 credits per vehicle. Multiplied out by the total number of vehicles, the company generated a grand total of 110,000 credits that it can use to make up the difference if it undercomplies in some later year. Credits can also be carried backward for three years, to cover noncompliance in an earlier year.

    These flexibilities in the regulation permit automakers to pursue a variety of pathways to compliance, under reduced time constraints.


  • What effects have the regulations had?

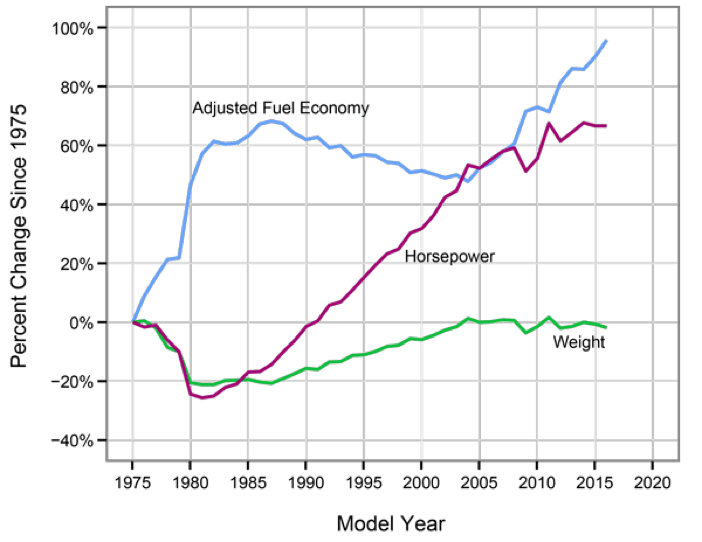
    The chart below, which plots average fuel economy, average engine horsepower, and average vehicle weight over time, shows how the relevant characteristics of the US light-duty vehicle fleet have changed since the first CAFE regulation in 1975.

    The early period, from 1975 to 1981, saw a sharp increase in fuel economy as annual targets rose, but a corresponding sharp decrease in engine power and vehicle weight. The period from the mid-1980s to the mid-2000s, when CAFE standards did not rise, saw a decline in average adjusted fuel economy and an increase in average vehicle mass, as automakers marketed (and consumers scarfed up) SUVs and pickups, which had lower fuel economy targets. Concurrently, the gap between adjusted and unadjusted fuel economy increased, further dragging down adjusted fuel economy. Engine power maintained its upward course, as automakers used improvements in power-train design (e.g., fuel injection replacing carburetors) to boost power in order to meet market demand for bigger, heavier vehicles.

    The last decade has seen fuel economy rising again, as regulations mandate annual increases in average efficiency. But engine power has also continued to rise, thanks to technological innovations like improved turbocharging and direct fuel injection, and vehicle weight has stayed level not because cars and trucks have remained the same size but because of the extensive and growing use of lightweight materials, driven by the need to meet fuel economy standards.

    In absolute terms, the average combined, unadjusted fuel economy of the U.S. light-duty vehicle fleet has risen from 15.3 mpg in 1975 to 32.5 mpg (estimated) in 2016. Adjusted combined fuel economy has risen from 13.1 mpg to 25.6 mpg.

  • What do the regulations cost?

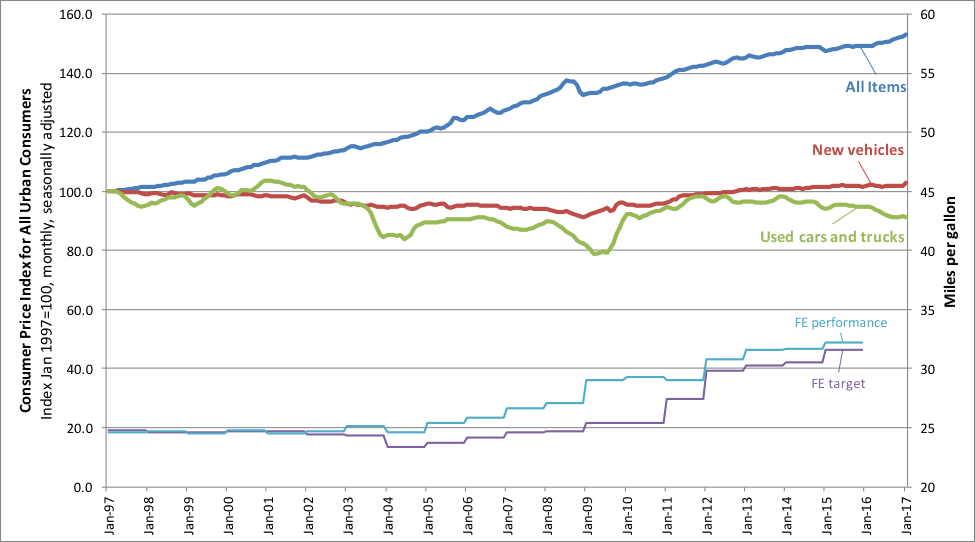
    From one perspective, effectively nothing. Average fuel economy rose from about 20 mpg in 1997 to about 32 mpg in 2016. A study by Consumers Union showed that the average inflation-adjusted price of new vehicles was essentially unchanged over those twenty years—a period in which the Consumer Price Index for all items rose by roughly 50%. (The price of high-end luxury vehicles has risen considerably, but that increase isn’t caused by fuel efficiency improvements.)

    chart - CPI new ldvs used ldvs all items

    Sources: Consumer’s UnionFederal Reserve Economic Data; EPA Fuel Economy Trends Report.

    However, this does not consider the general cost reductions achieved by manufacturers every year. An alternative is to look at the costs of fuel-efficient designs and technologies specifically. The EPA and NHTSA estimate that the average per-vehicle cost of meeting the current CAFE/GHG standards from 2015 to 2025 will be $1,378. Over that time, average unadjusted fuel economy will rise from 31.4 mpg to 51.4 mpg (estimated); adjusted fuel economy will rise from 24.8 mpg in 2015 to about 40 mpg in 2025. Assuming a vehicle lasts 150,000 miles (a conservative assumption), that’s nearly 2,300 gallons of gasoline not bought over the life of that average vehicle. Since 1918, the inflation-adjusted average annual price of a gallon of gasoline is $2.64; since 1976 it’s $2.55. At those prices that works out to about $5,800 not spent on fuel for that average vehicle, meaning that the net cost making that vehicle comply with the fuel efficiency standards is negative—that is, a significant savings to the consumer.

  • Sources and credits

    Edited by Aaron Isenstadt, Joe Schultz

    Sources

    U.S. Code of Federal Regulations: 49 CFR 523, 531, 533, 536, 537, and 40 CFR 85, 86, 600, all available online at https://www.ecfr.gov

    Consumers Union, More Mileage for Your Money