Blog
Update on “real-world" fuel consumption in European passenger cars
In 2012 ICCT carried out an analysis of “real-world” fuel consumption data in Germany for the years 2001–2010, based on data from the German website spritmonitor.de. This is an online database with more than 200,000 registered users who regularly provide fuel consumption values collected in the course of their daily driving.
We recently updated that study, and have now covered about 70,000 individual vehicles, compared to about 28,000 in our initial review. We also extended the time range covered to include 2011 data.
The updated analysis confirms the original findings. While the fuel consumption values reported by different users for the same vehicle configuration will vary due to differences in driving styles and driving conditions, the large set of data permits a clear trend to emerge. Based on this most recent analysis, the average discrepancy between fuel consumption and CO2 values reported in spritmonitor.de and the official numbers determined in the vehicle type-approval process increased from about 7 percent in 2001 to about 23 percent in 2011 (see the chart below). In other words, the average on-road CO2 emission levels of new cars were about 23 percent higher than the official levels provided by manufacturers.
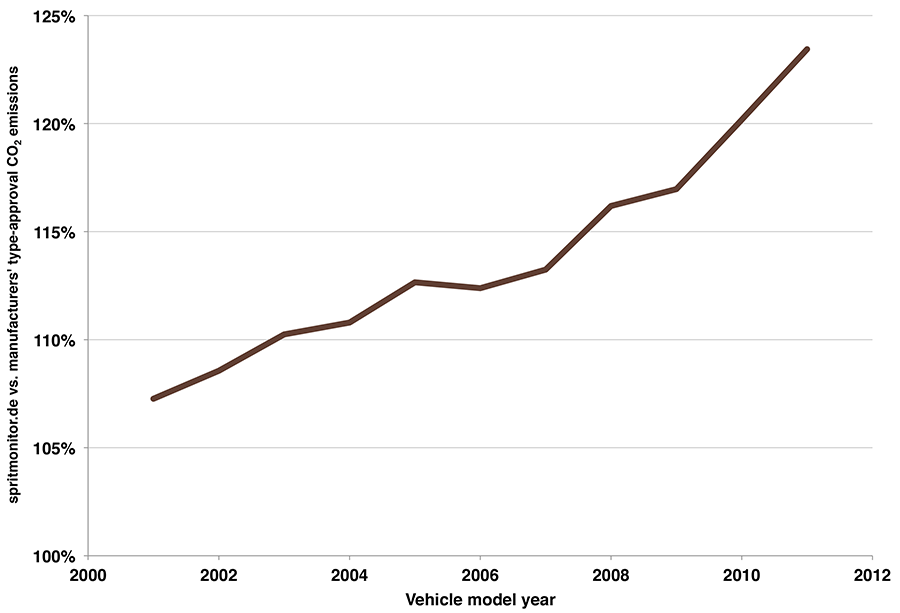
More concerning than the absolute number is the increasing divergence over time. The trend shows no sign of leveling off, as the 23 percent deviation in 2011 is larger than the 20 percent deviation for 2010. It seems unlikely that this is attributable to driver behavior. While the driving style of spritmonitor.de users may not be representative of all drivers, it is at least reasonable to assume that it has not changed significantly over time, which would lead one to expect the calculated deviation between real-world and type-approval fuel consumption to remain fairly constant. (For some possible reasons why the trend is instead going up, see here and here [.pdf].)
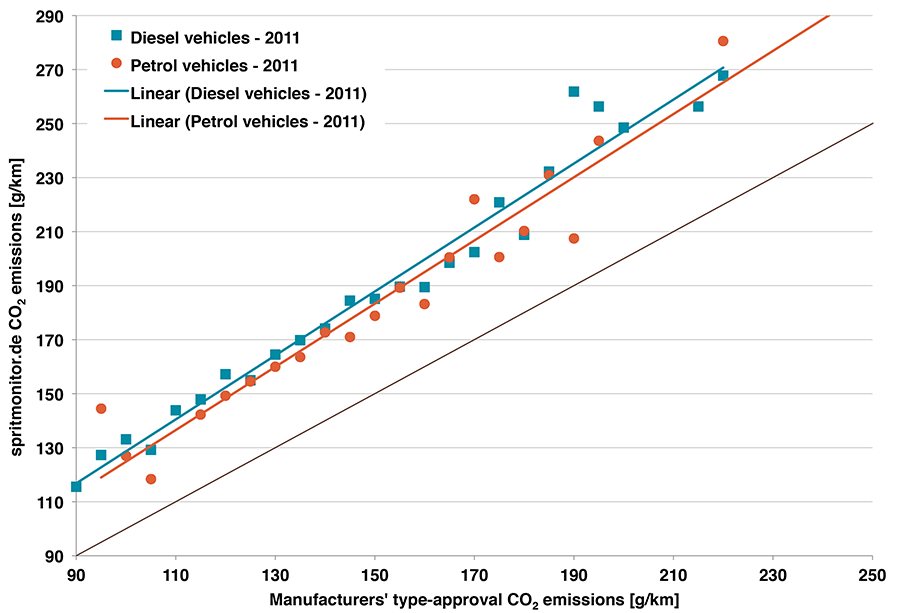
It is also interesting to analyze the available data for individual vehicle segments. The chart below plots the on-road spritmonitor.de CO2 emission levels against the respective manufacturers’ type-approval values (aggregated to 5 g/km clusters). The black line represents a hypothetical case in which on-road and type-approval values were exactly the same. As can be seen, most of the data points are located along a line about 20 percent higher than that case—an indication that the increasing divergence is system wide and is not caused by a subset of vehicle segment.
We are working on similar analyses of other data sources, among them datasets provided by leasing companies across Europe, and plan on publishing an extensive report on the subject later this year.