Market Spotlight
European Market Monitor: Cars and Vans (September 2025)
Passenger car registrations
The average share of battery electric vehicles (BEVs) among total new registrations in Europe grew to 20% in September 2025, up from 19% in August. After forming a new manufacturing pool with BYD, the Nissan pool led in BEV sales shares in September with 28%, followed by the Mercedes-Volvo-Polestar-Smart pool at 27%. They were followed by the BMW pool (26% share), as well as the Hyundai (21%), Kia (21%), and Tesla (20%) pools. The Volkswagen pool (19%), Renault pool (13%) and SAIC (13%) were below the European average. For 2025 year-to-date (YTD), the BEV share remained stable at 17%, which represents an increase of 3 percentage points compared with the same period in 2024. Several manufacturing pools had significant increases in BEV shares in 2025 YTD versus the same period in 2024. Kia (20%) recorded an 8 percentage-point increase, while BEV shares for the Hyundai (18%) and Volkswagen (18%) pools both increased 7 percentage points. In contrast, SAIC stood out with a drop in BEV share from 37% in January–September 2024 to only 13% in 2025 YTD. Plug-in hybrid electric vehicles (PHEVs) had an average market share among new registrations in Europe of 9% in 2025 YTD (up 2 percentage points over the same period in 2024), led by the Mercedes-Volvo-Polestar-Smart pool (24% share). For full hybrid electric vehicles (HEVs), SAIC (42%), the Renault pool (29%) and the Nissan pool (25%) recorded the largest shares in 2025 YTD. In the mild hybrid electric (MHEV) segment, the BMW and Mercedes-Volvo-Polestar-Smart pools led in registration shares, at 37% and 36%, respectively, in 2025 YTD.
Figure 1. Share of battery electric in new passenger car registrations in Europe
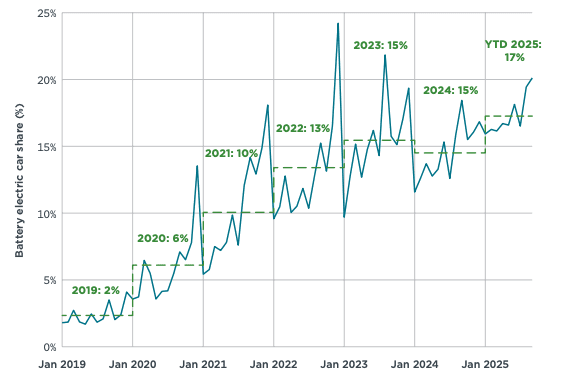
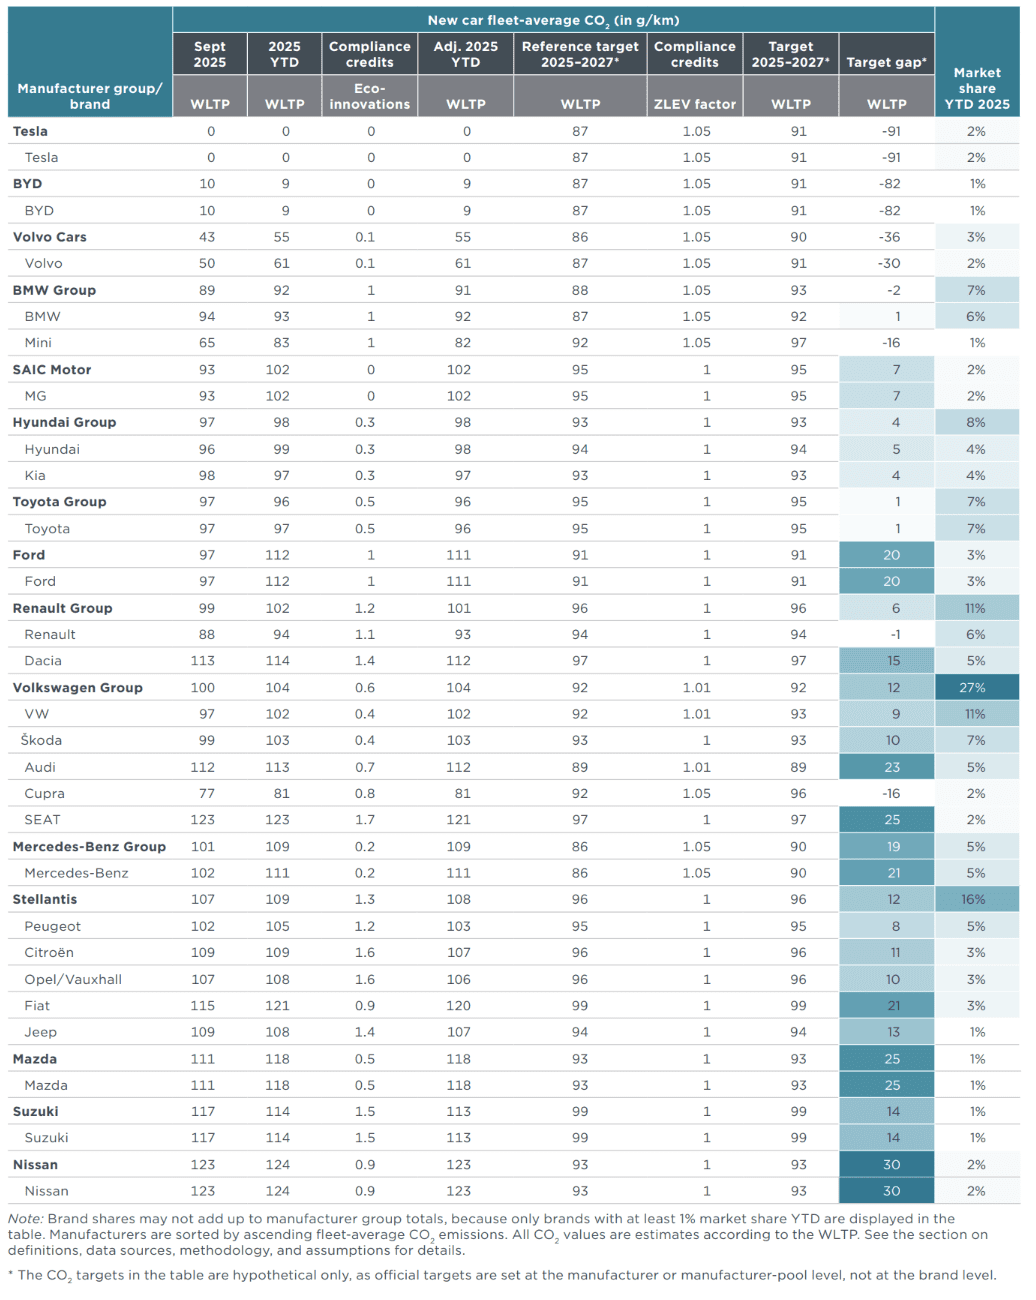
Figure 2. Average CO2 emissions of manufacturer pools and individual manufacturers compared with estimated 2025-2027 targets, 2025 YTD
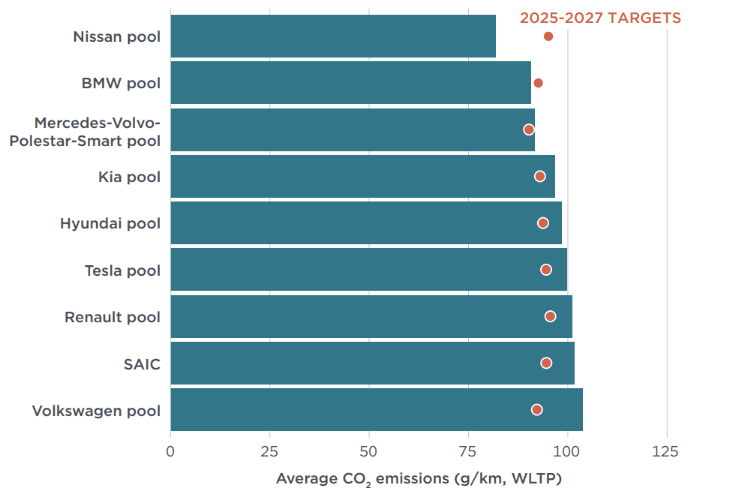
Note: Includes compliance credits. All CO2 values are estimates according to the Worldwide harmonized Light vehicles Test Procedure (WLTP). Only manufacturer pools and individual manufacturers with at least 1% market share YTD are shown. See the section on definitions, data sources, methodology, and assumptions for more.
Carbon dioxide (CO2) emissions among manufacturer pools averaged 100 g CO2/km in 2025 YTD. Manufacturing pools thus remain 7 g CO2/km from the average target of 92 g CO2/km for the 2025–2027 period. SAIC reduced its target gap by 2 g CO2/km compared with the previous month and the Tesla and Mercedes-Volvo-Polestar-Smart pools, with a combined market share of 40%, reduced their target gap by 1 g CO2/km. The newly formed Nissan pool and the BMW pool are currently in compliance with their 2025–2027 targets (13 and 2 g CO2/km below, respectively), while the Volkswagen pool (12 g CO2/km above) is the farthest behind.
Looking at individual car brands with market shares of 1% or greater, Tesla and BYD had the greatest over-compliance at 91 and 82 g CO2/km below their projected brand-level average targets for 2025–2027, respectively, followed by Volvo (30 g CO2/km below), Cupra, and Mini (both 15 g CO2/km below). Nissan (30 g CO2/km above), Mazda, SEAT (both 25 g CO2/km above) and Audi (23 g CO2/km above) currently have the largest target gaps. Ford and MG reduced their target gaps by 2 g CO2/km each compared with the previous month.
Table 1. Share of battery electric, plug-in hybrid, full hybrid, and mild hybrid passenger cars by manufacturer pool or large manufacturer not forming a pool
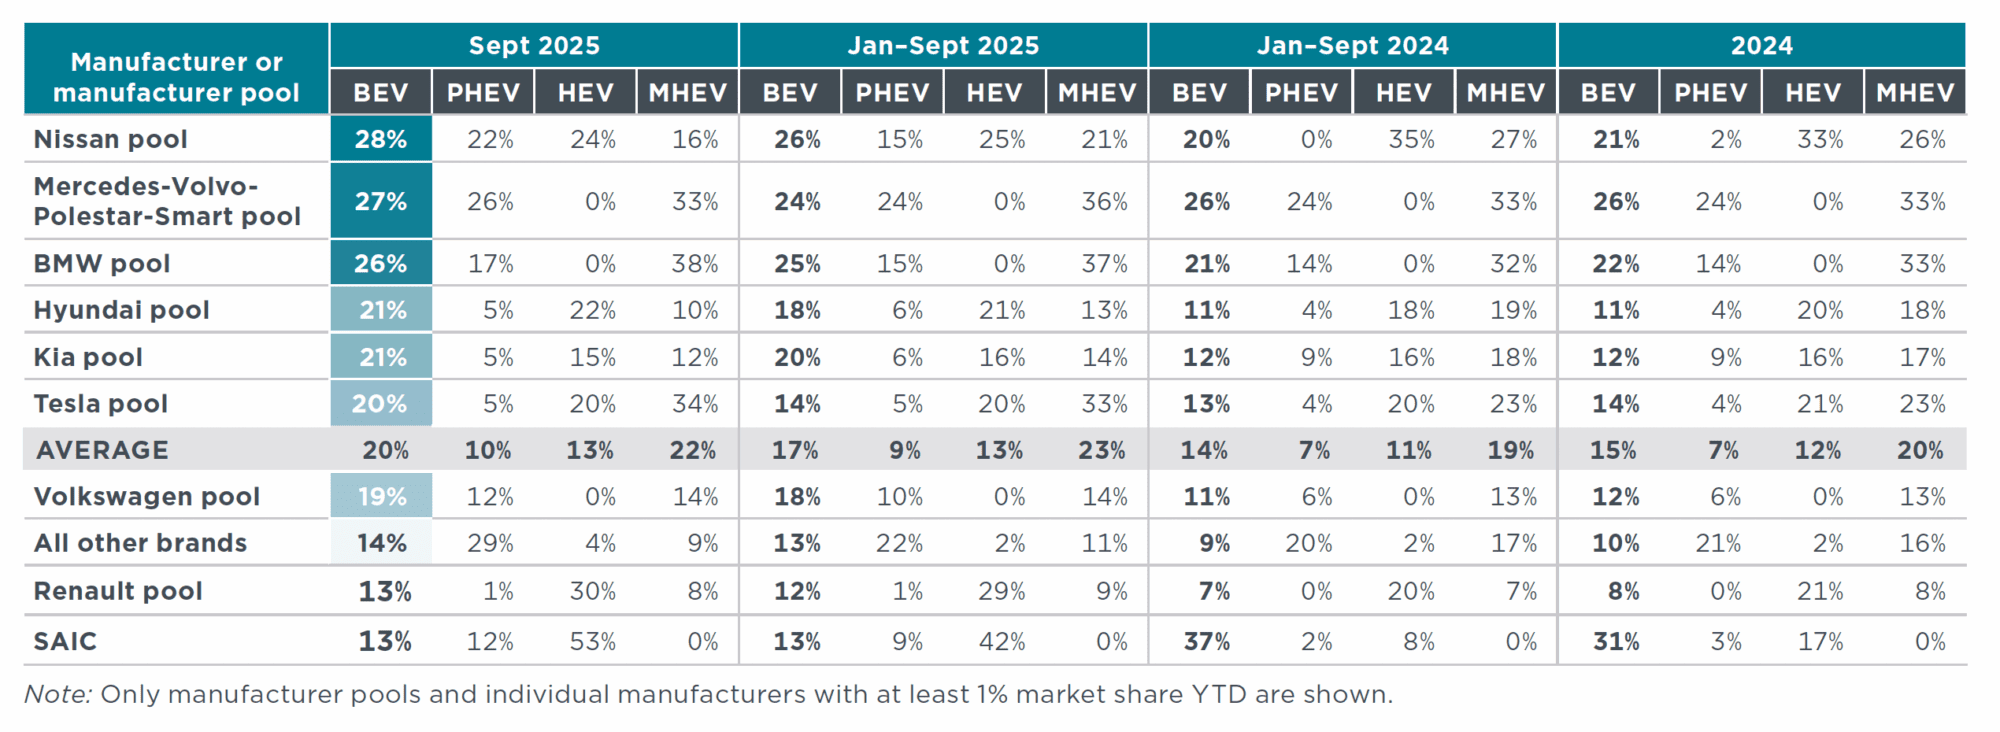
Table 2. Fleet-average CO2 emissions of new passenger cars and market share by manufacturer pool or large manufacturer not forming a pool
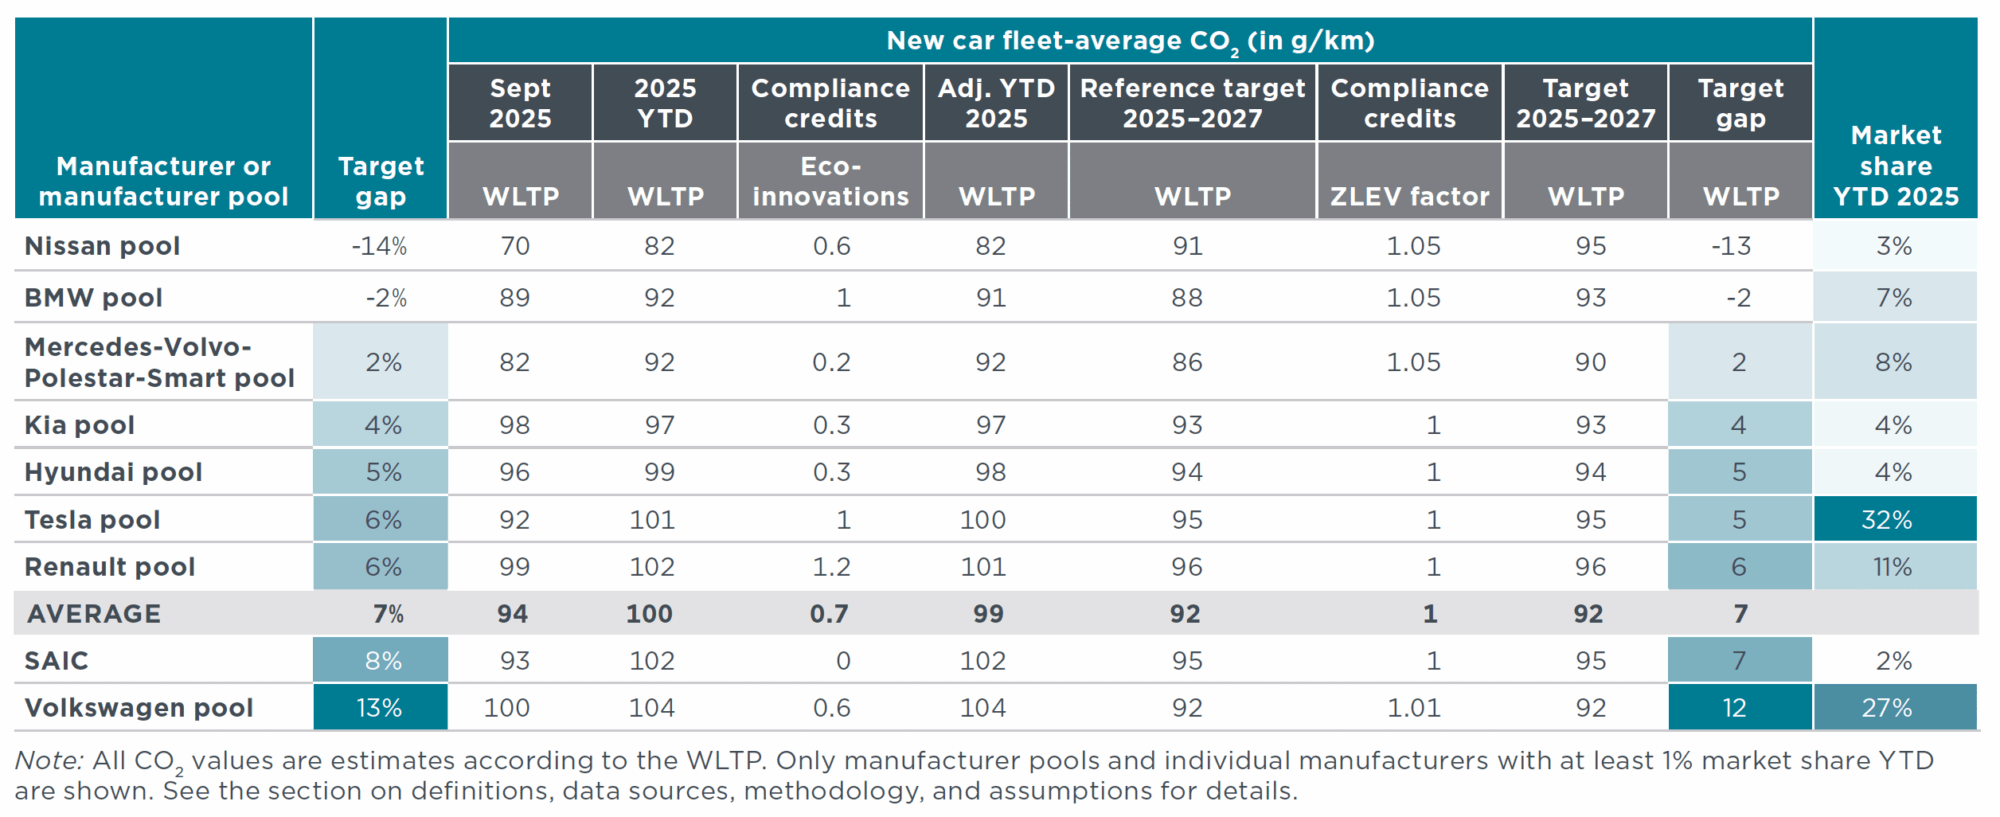
Table 3. Fleet-average CO2 emissions of new passenger cars and market share by manufacturer group and brand
Passenger car registrations by country
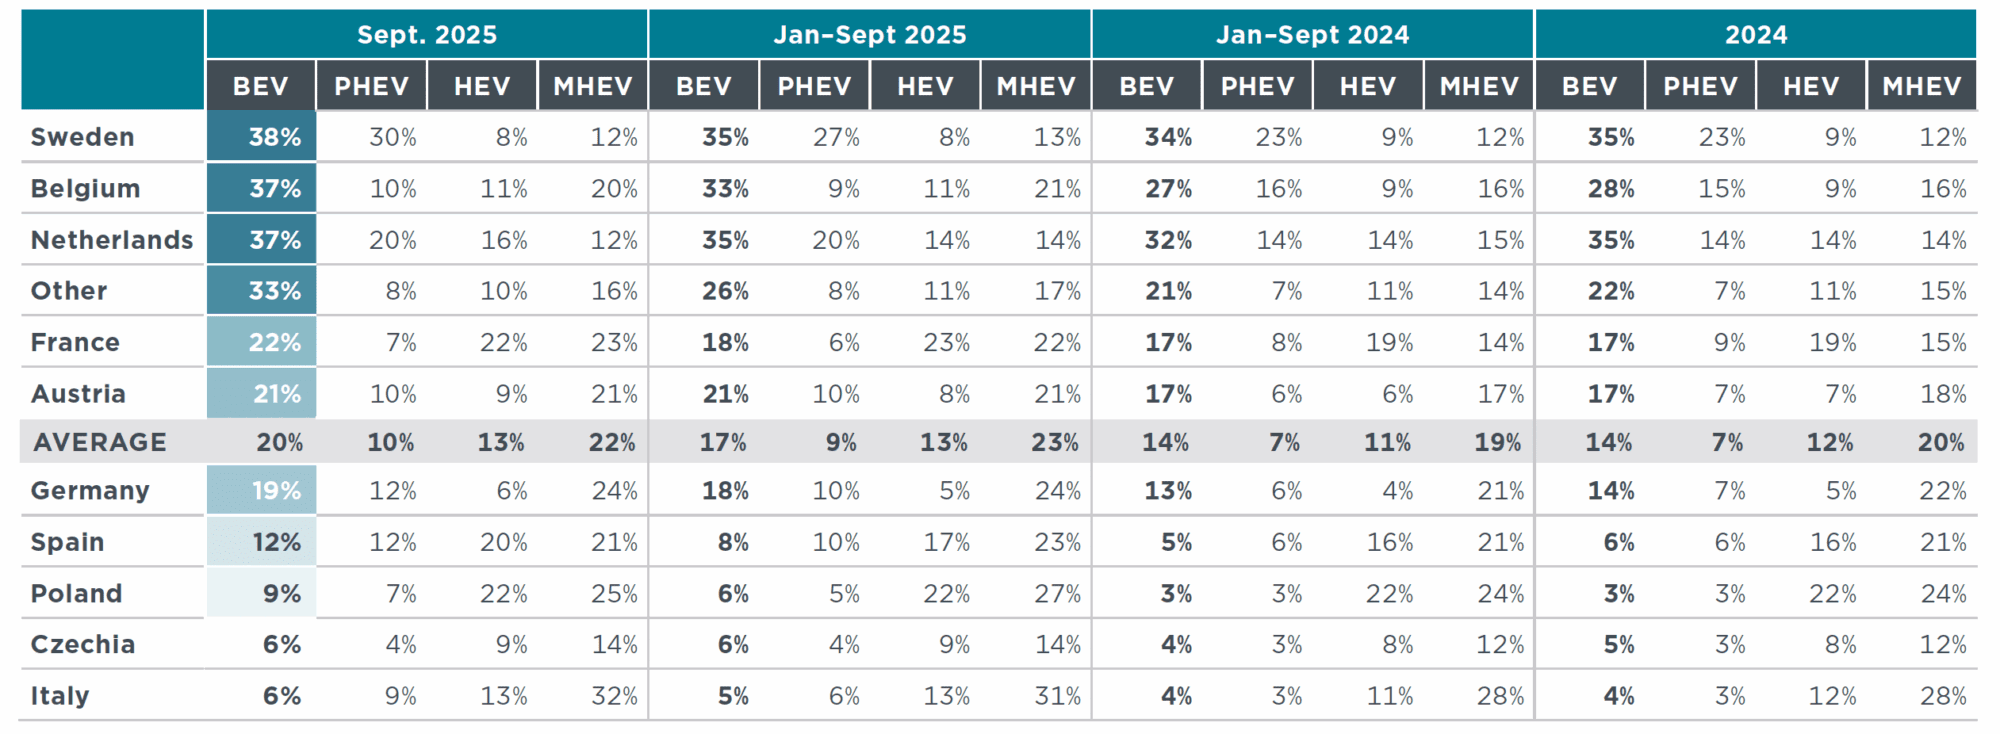
Between January and September 2025, total passenger car registrations among the major European markets grew the most in Spain (+15%) and Austria (+12%) compared with the same period in 2024, while registrations declined the most in Belgium (-9%) and France (-6%). Focusing on the largest markets by combined new BEV and PHEV registrations, Norway (97%), Denmark (68%), Sweden (62%), and the Netherlands (55%) all had combined shares above 50%. Belgium (42%), Austria (31%), and Germany (28%) also recorded combined BEV and PHEV market shares above the average of 26% for Europe. Among the largest markets by total new passenger car registrations, BEV registration growth was strongest in Poland (+107%), Spain (+89%), Austria (41%), and Czechia (+41%) in 2025 YTD compared with the same period in 2024. Germany, the largest European vehicle market, continued to see significant growth, with BEV registrations up 38% in 2025 YTD compared with the same period in 2024 and over 45,000 units registered in September alone. Registrations of PHEVs increased the most in Spain (+107%) and Poland (+92%) in 2025 YTD compared with 2024. Looking at the HEV market, shares of new registrations were the highest in France (23%) and Poland (22%) in 2025 YTD. Shares of MHEVs were highest in Italy (31%) and Poland (27%) in 2025 to date, and MHEVs are gaining popularity in France, where they made up 22% of new registrations, representing a 46% increase compared with the same period in 2024.
Figure 3. Share of plug-in hybrid and battery electric passenger cars by country, including information on market size (total new car registrations)
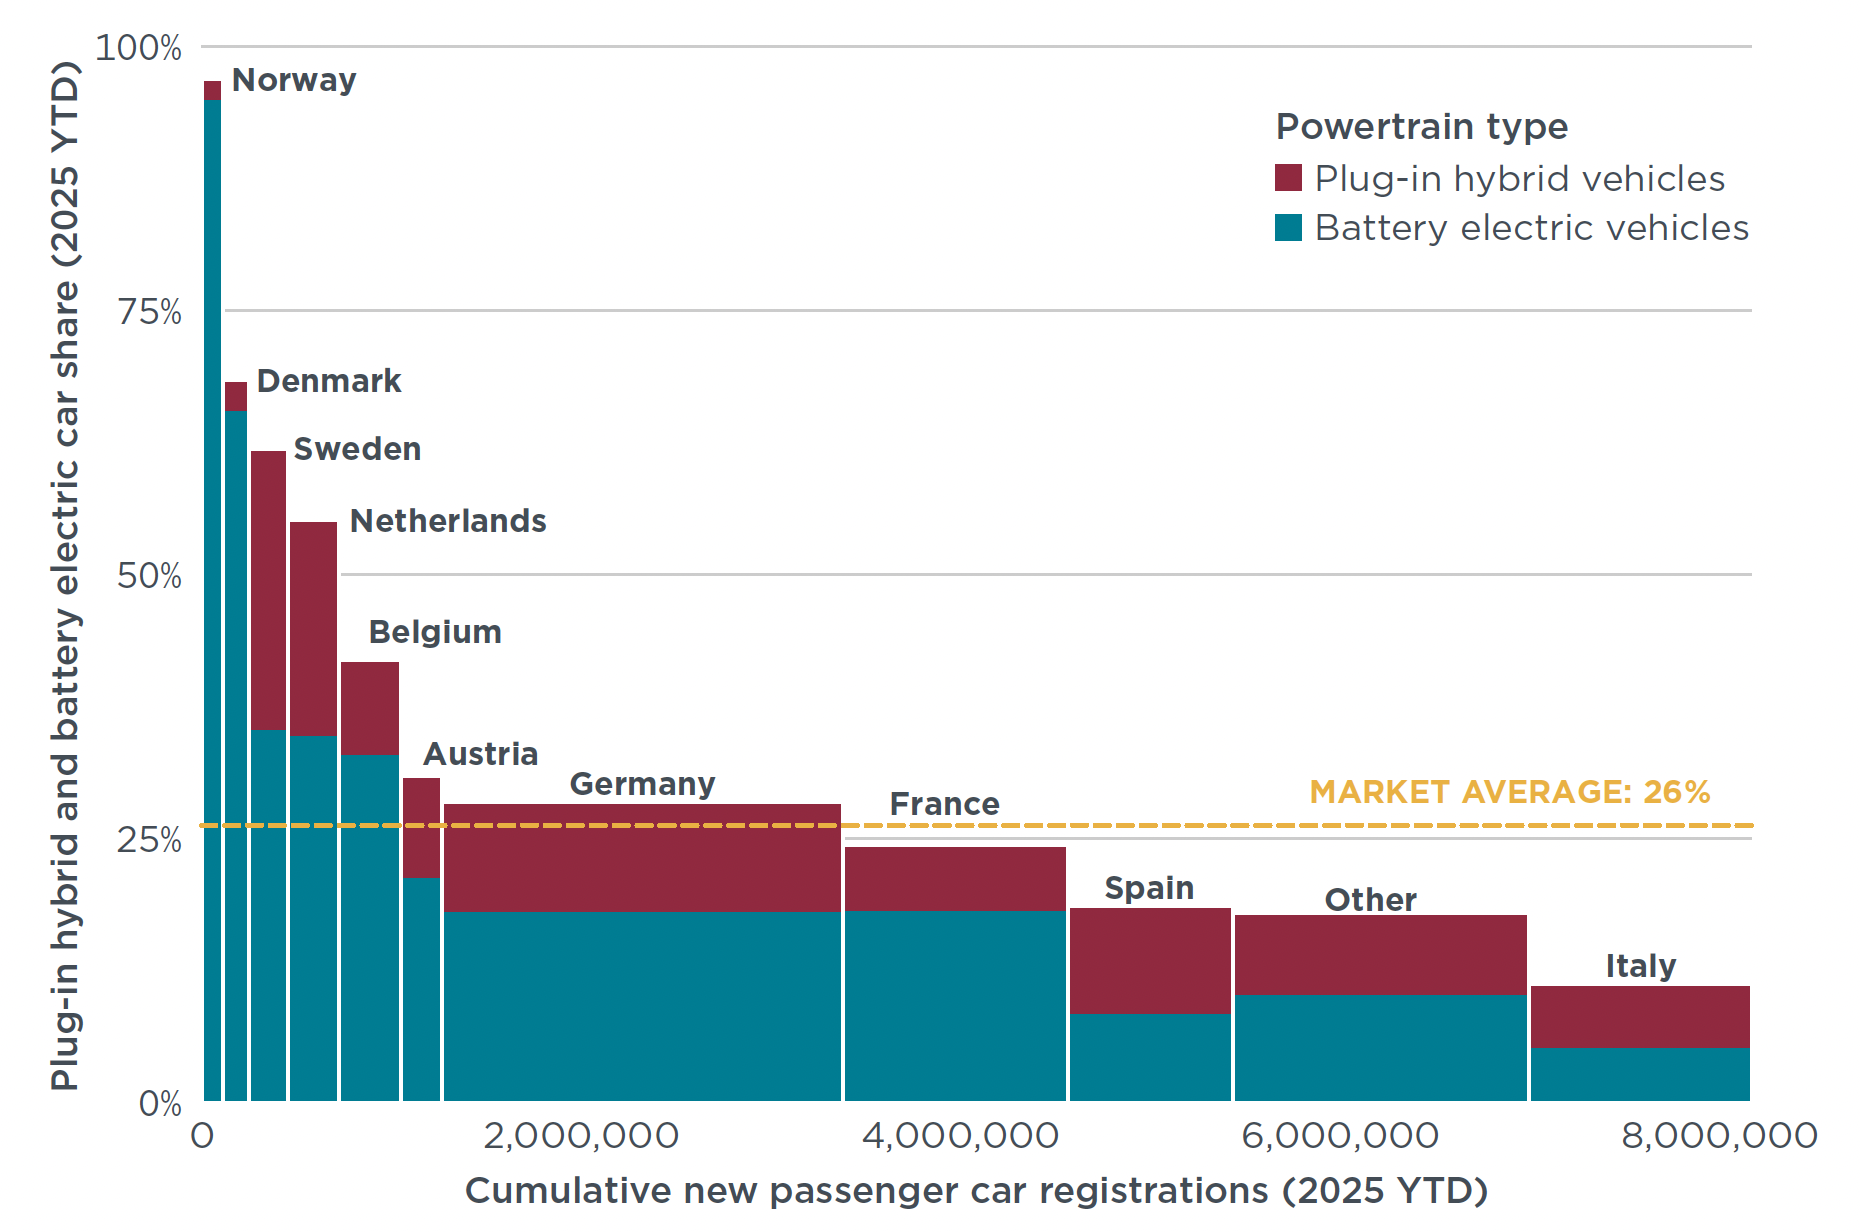
Note: The figure highlights the 10 largest markets by new BEV and PHEV registrations YTD. The “Other” category includes all remaining EEA countries not individually highlighted, except for Bulgaria, Liechtenstein, and Malta.
Table 4. New passenger car registrations by country
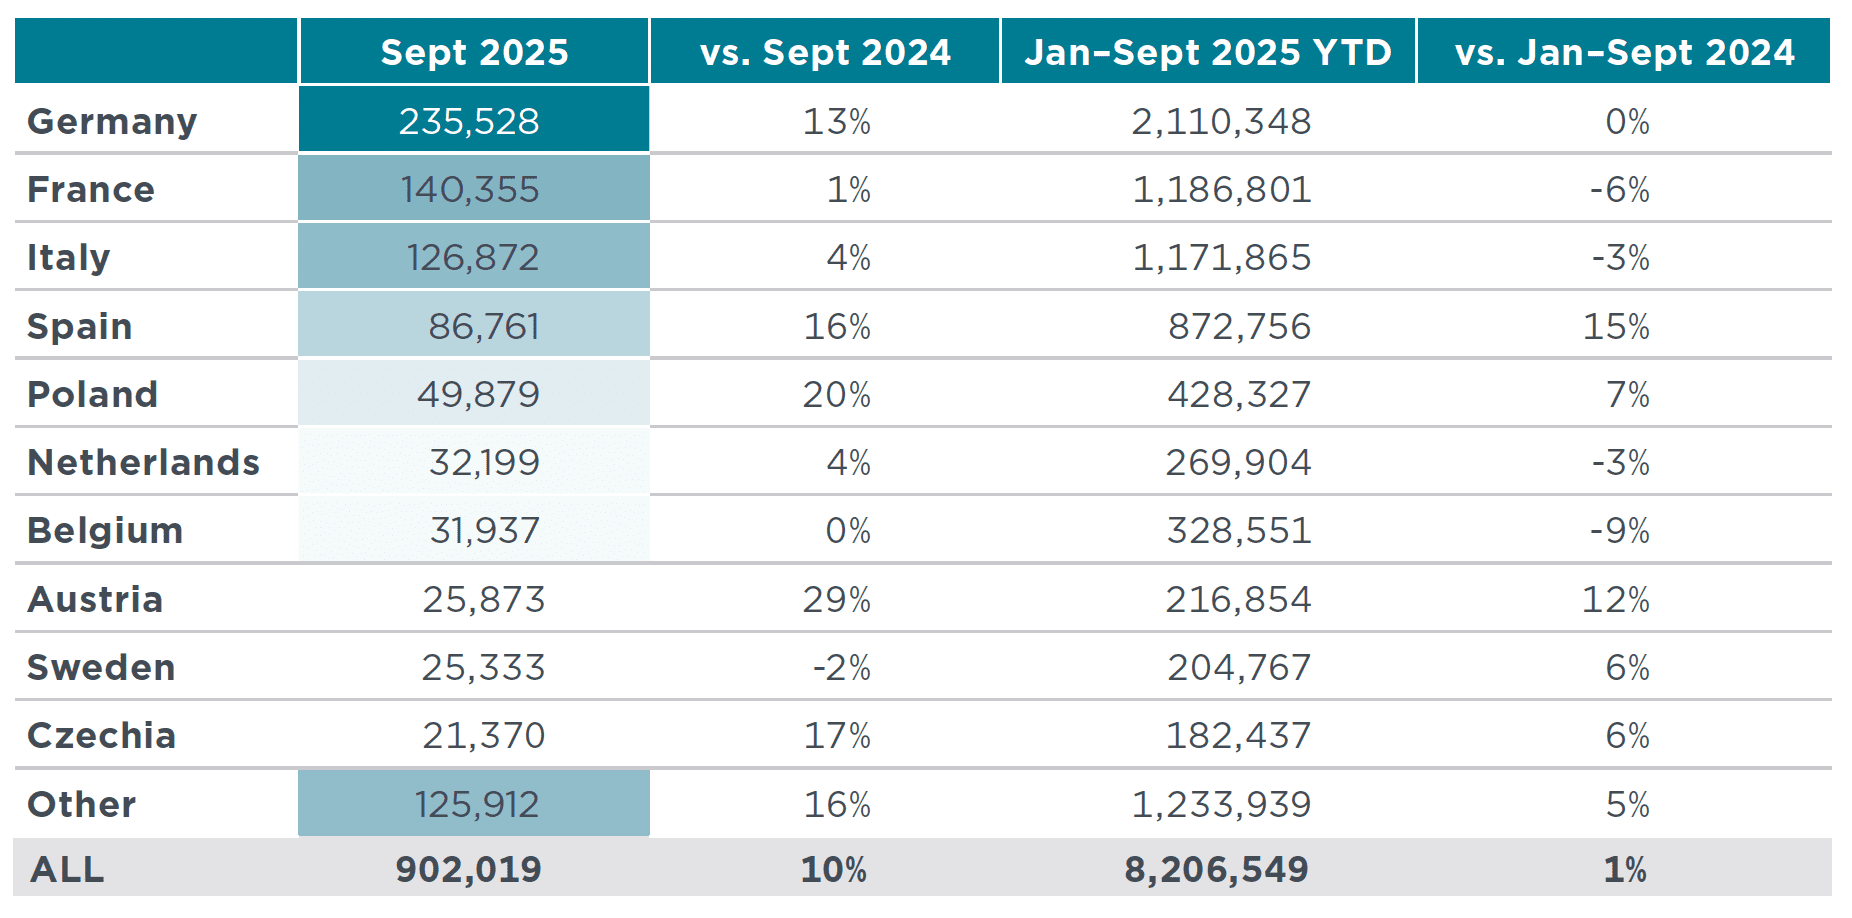
Table 5. New battery electric, plug-in hybrid, hybrid, and mild hybrid passenger car registrations by country
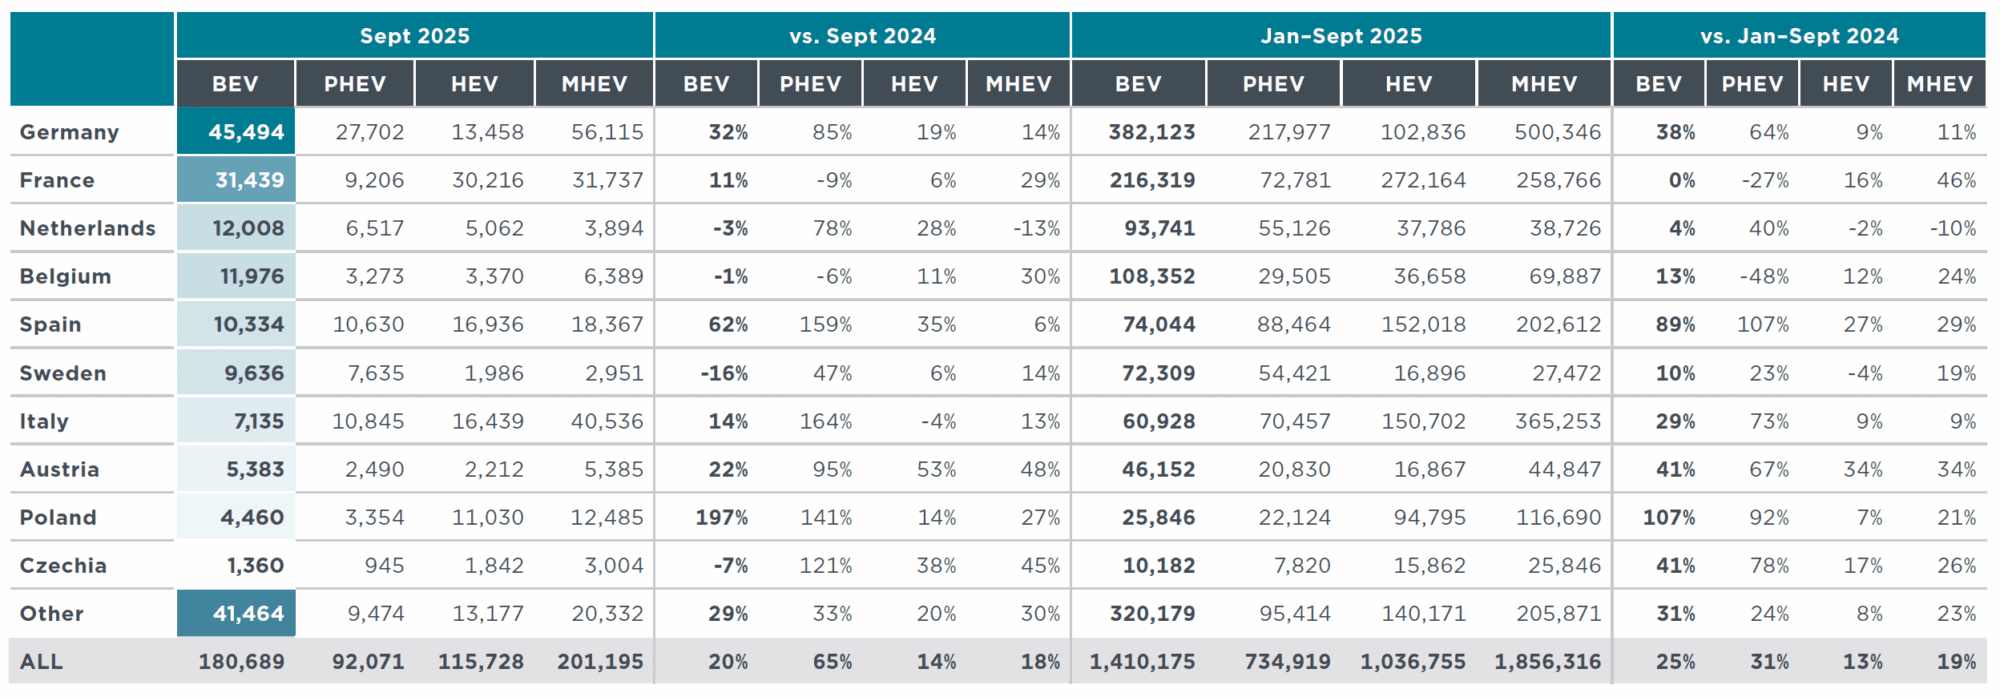
Table 6. Share of new battery electric, plug-in hybrid, full hybrid, and mild hybrid passenger cars by country
Passenger car registrations by owner
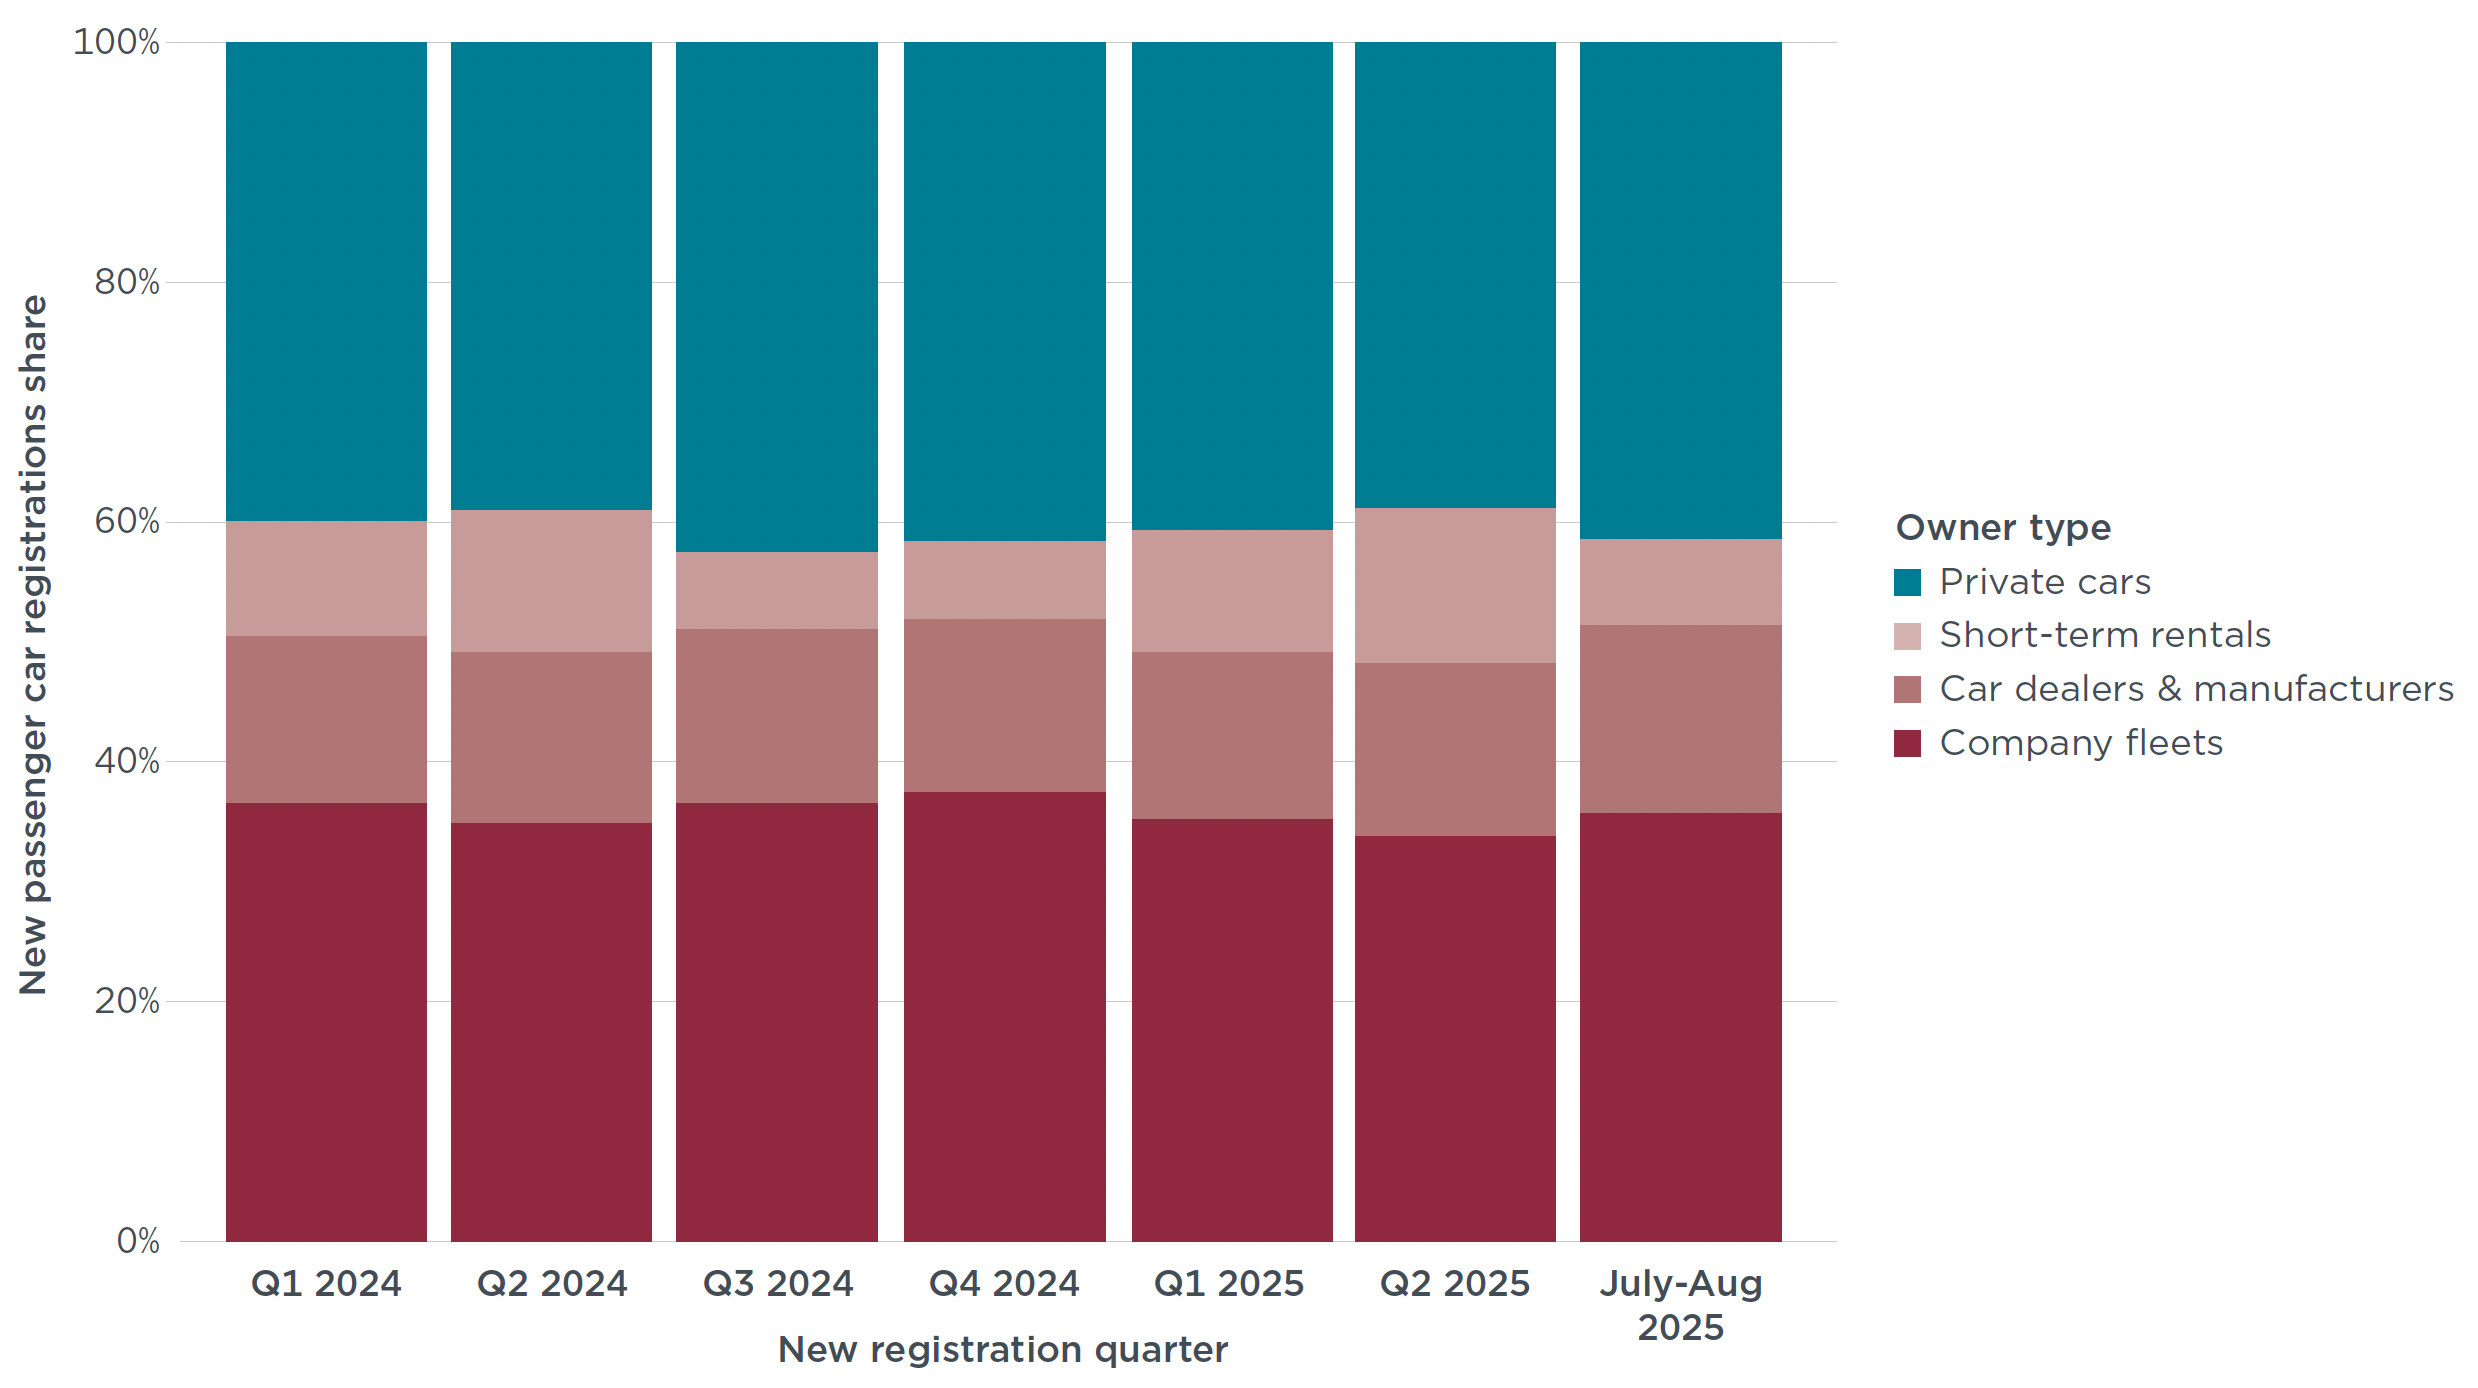
Corporate fleets, comprised of company fleets (36%), car dealers and manufacturers (16%) and short-term rentals (7%), made up 59% of the total registrations in July through August 2025, while private cars made up 41% of the market. Short-term rental registrations fluctuate more than other owner types, ranging from only 6% in Q3 2024 to nearly 13% of sales in Q2 2025.
Figure 4. New passenger car registrations by owner for 19 select European countries
Van registrations
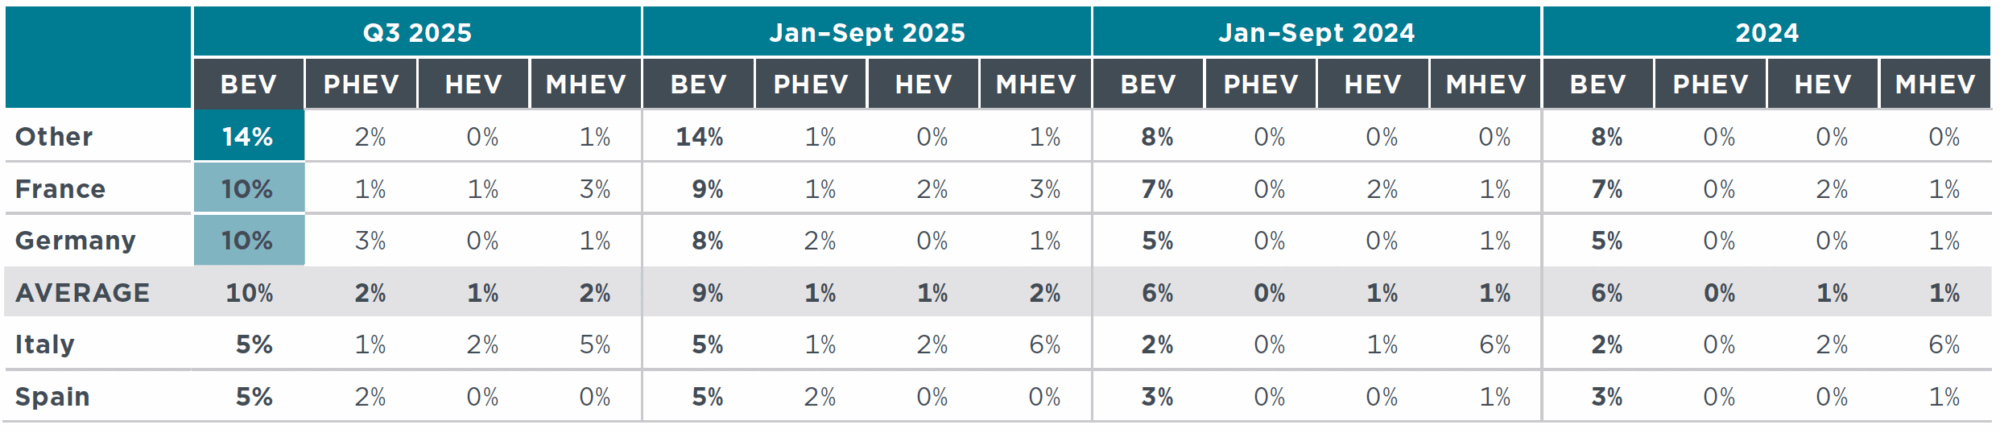
New van registrations declined in France (-8%), Germany (-6%), and Italy (-6%) in 2025 YTD, compared with the same period in 2024, while registrations in Spain grew by 10%. Of newly registered vans, 9% in France and 8% in Germany were battery electric in 2025 to date, compared with a respective 7% and 5% over the same period in 2024, and shares reached 10% in both countries in Q3 2025. The Toyota pool (19%), the Mercedes-Benz pool (15%), the Renault pool (12%), Nissan (12%) and the Volkswagen pool (11%) all had BEV shares at or above the European average in Q3 2025, while the Ford (8%) and Stellantis (6%) pools as well as Iveco (1%) were below the average. BEV shares increased the most for the Toyota and Renault pools in 2025 YTD, with each increasing 6 percentage points over the same period in 2024. Looking at fleet-average CO2 emissions of manufacturers and pools, the average target gap is estimated at 14 g CO2/km after Q3 2025, down from 17 g CO2/km after Q2 2025. The Mercedes-Benz pool notably reduced its target gap by 6 g CO2/km after Q3 2025 while Iveco is currently the farthest from its 2025 CO2 target with a gap of 34 g CO2/km.
Table 7. Share of battery electric, plug-in hybrid, full hybrid, and mild hybrid vans by manufacturer pool or large manufacturer not forming a pool
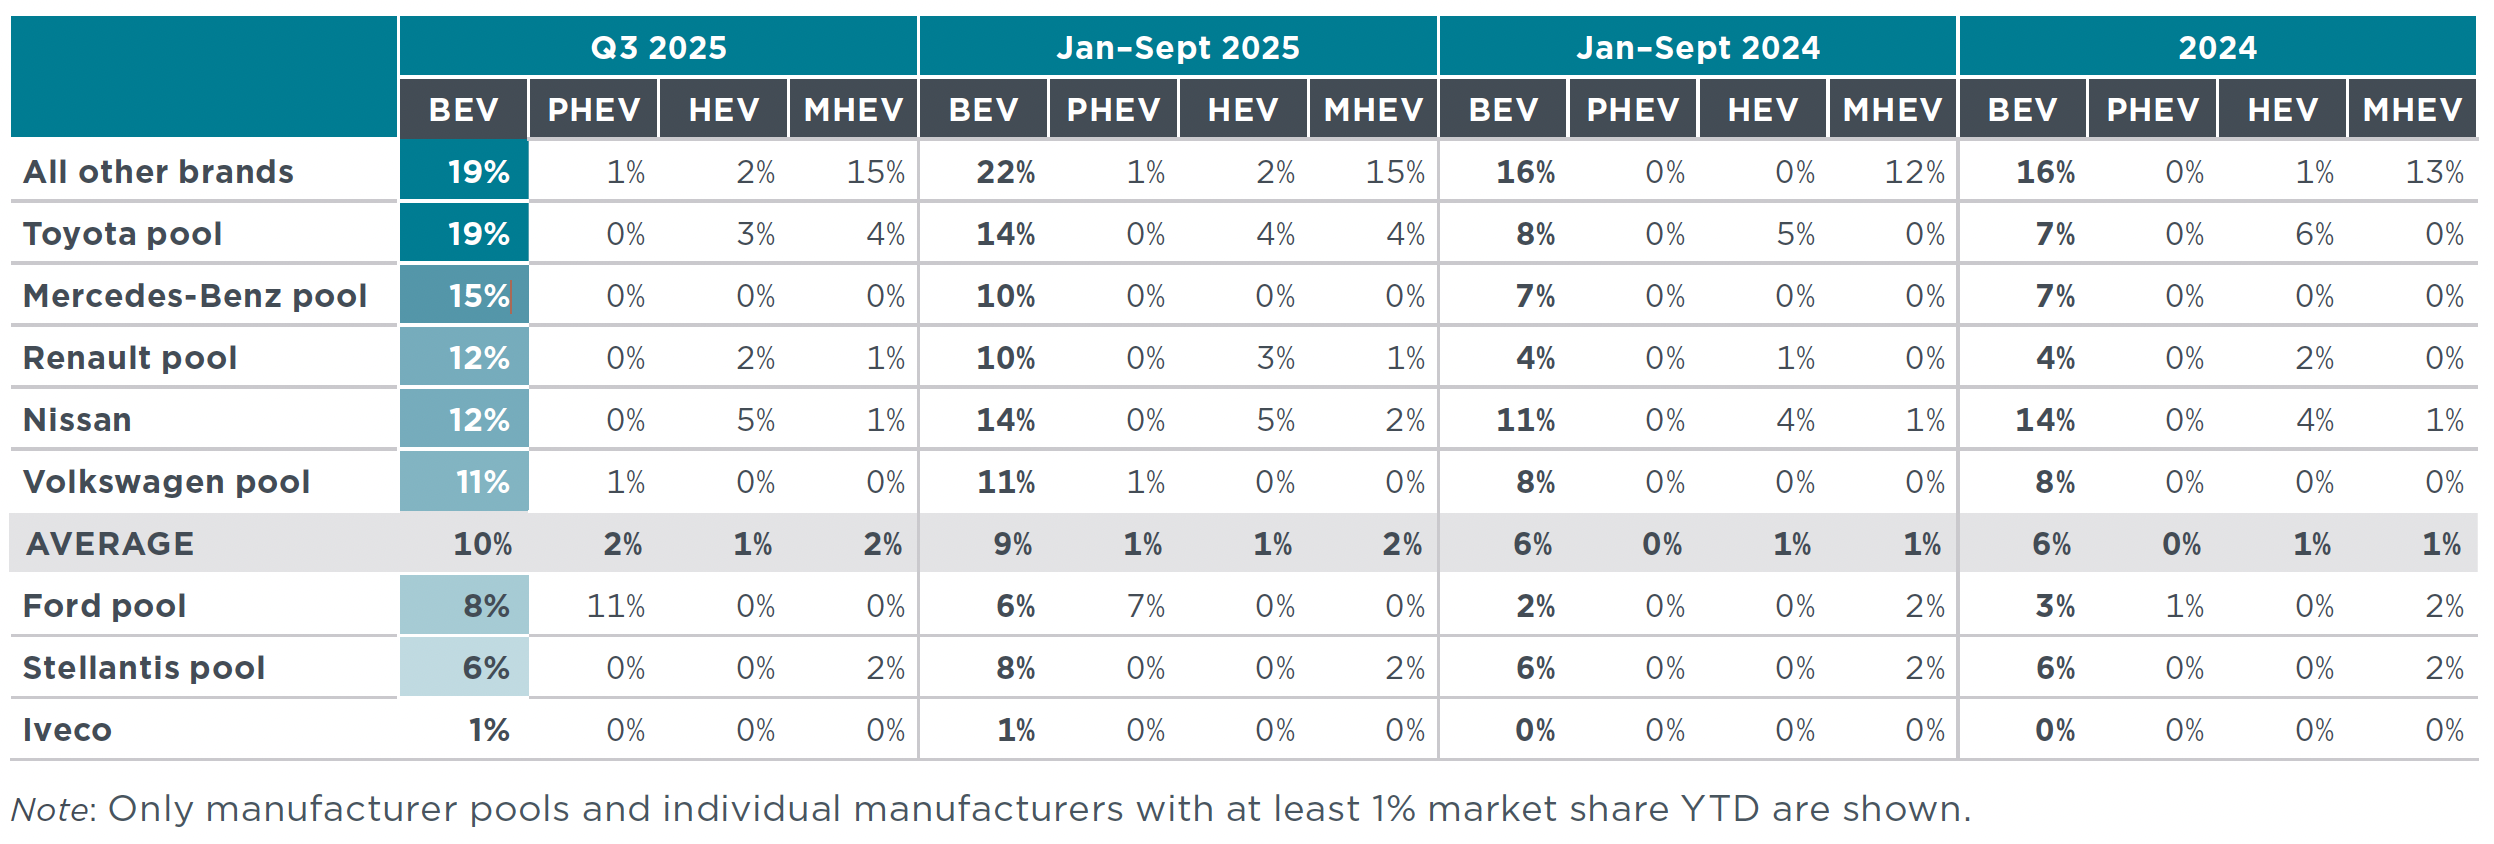
Table 8 . Fleet-average CO2 emissions of new vans and market share by manufacturer pool or large manufacturer not forming a pool
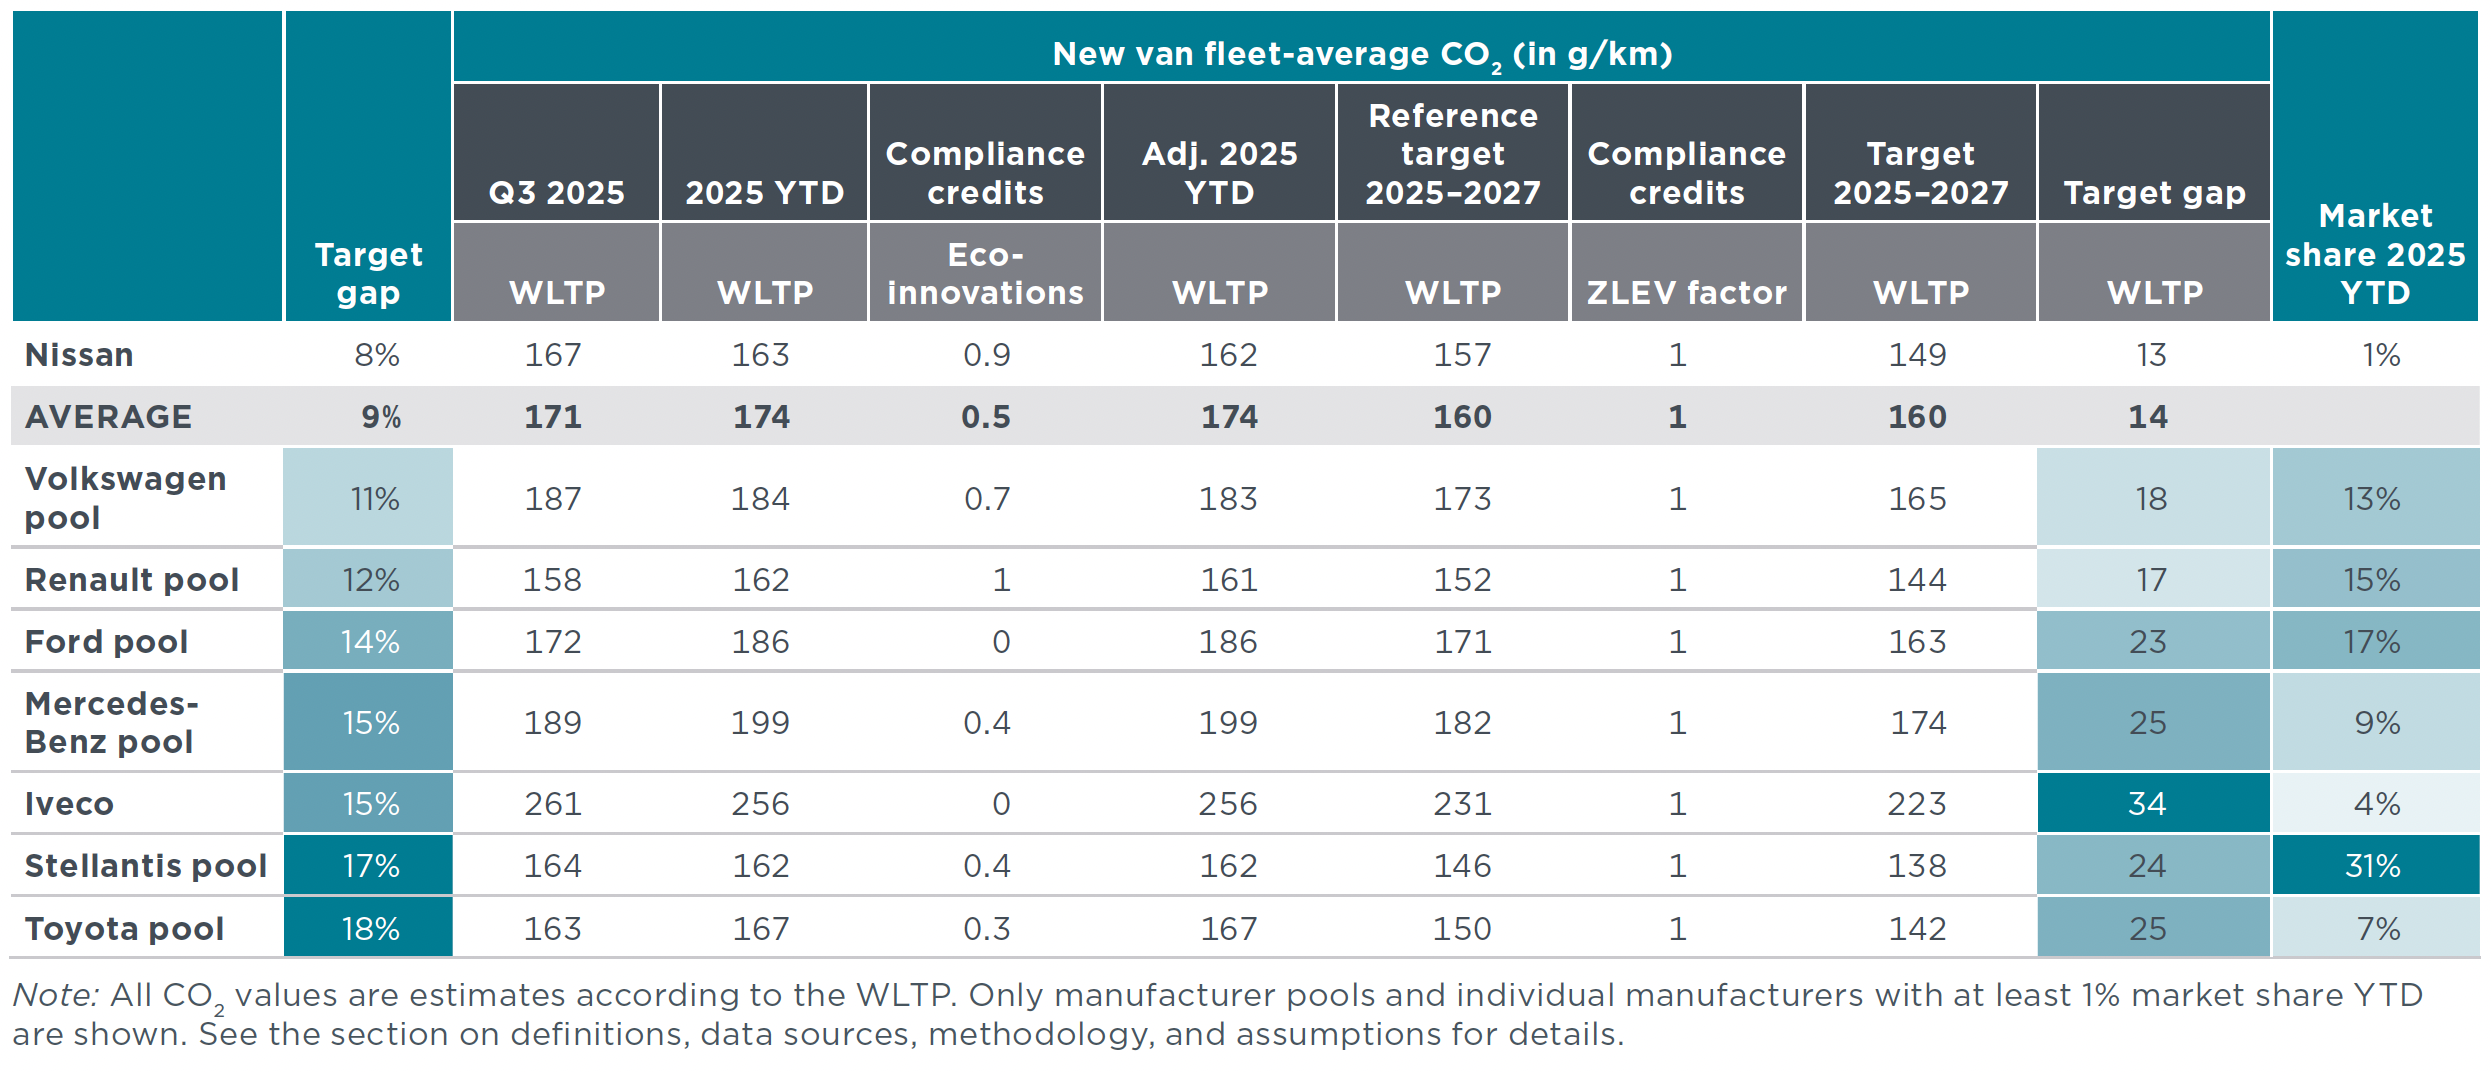
Table 9. New van registrations by country
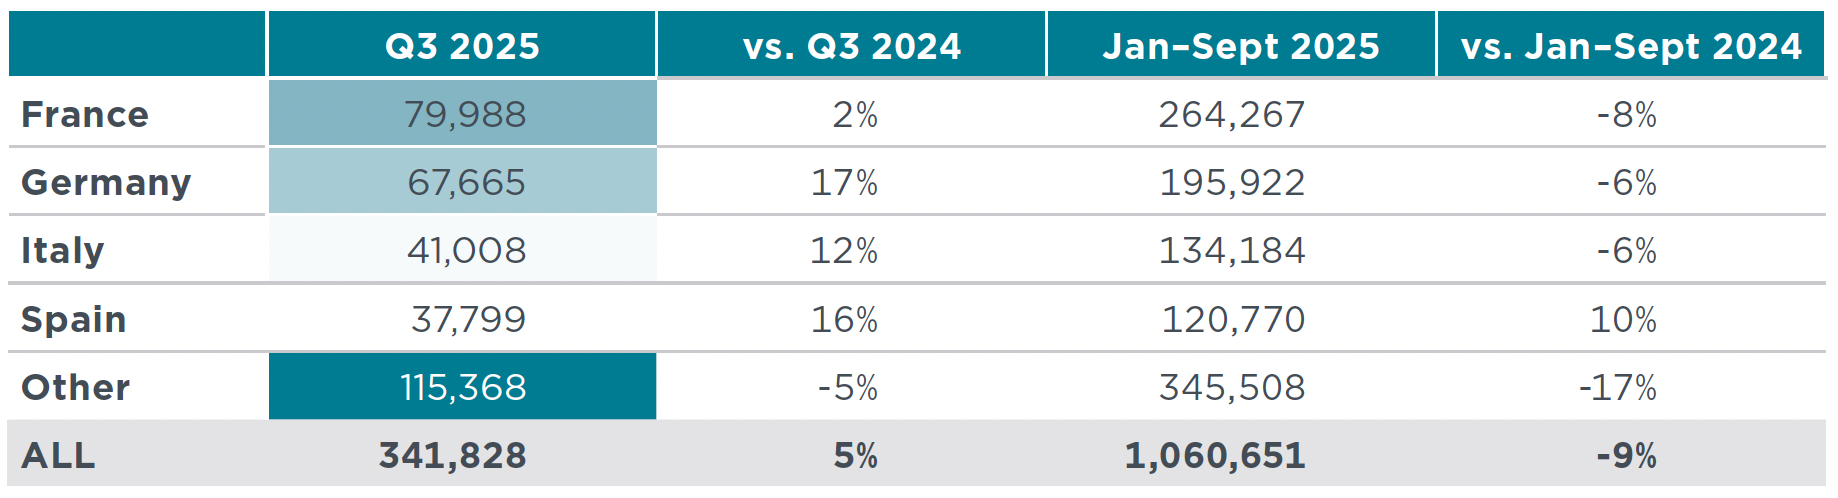
Table 10. Share of battery electric, plug-in hybrid, hybrid, and mild hybrid vans by country
Charging Infrastructure Development
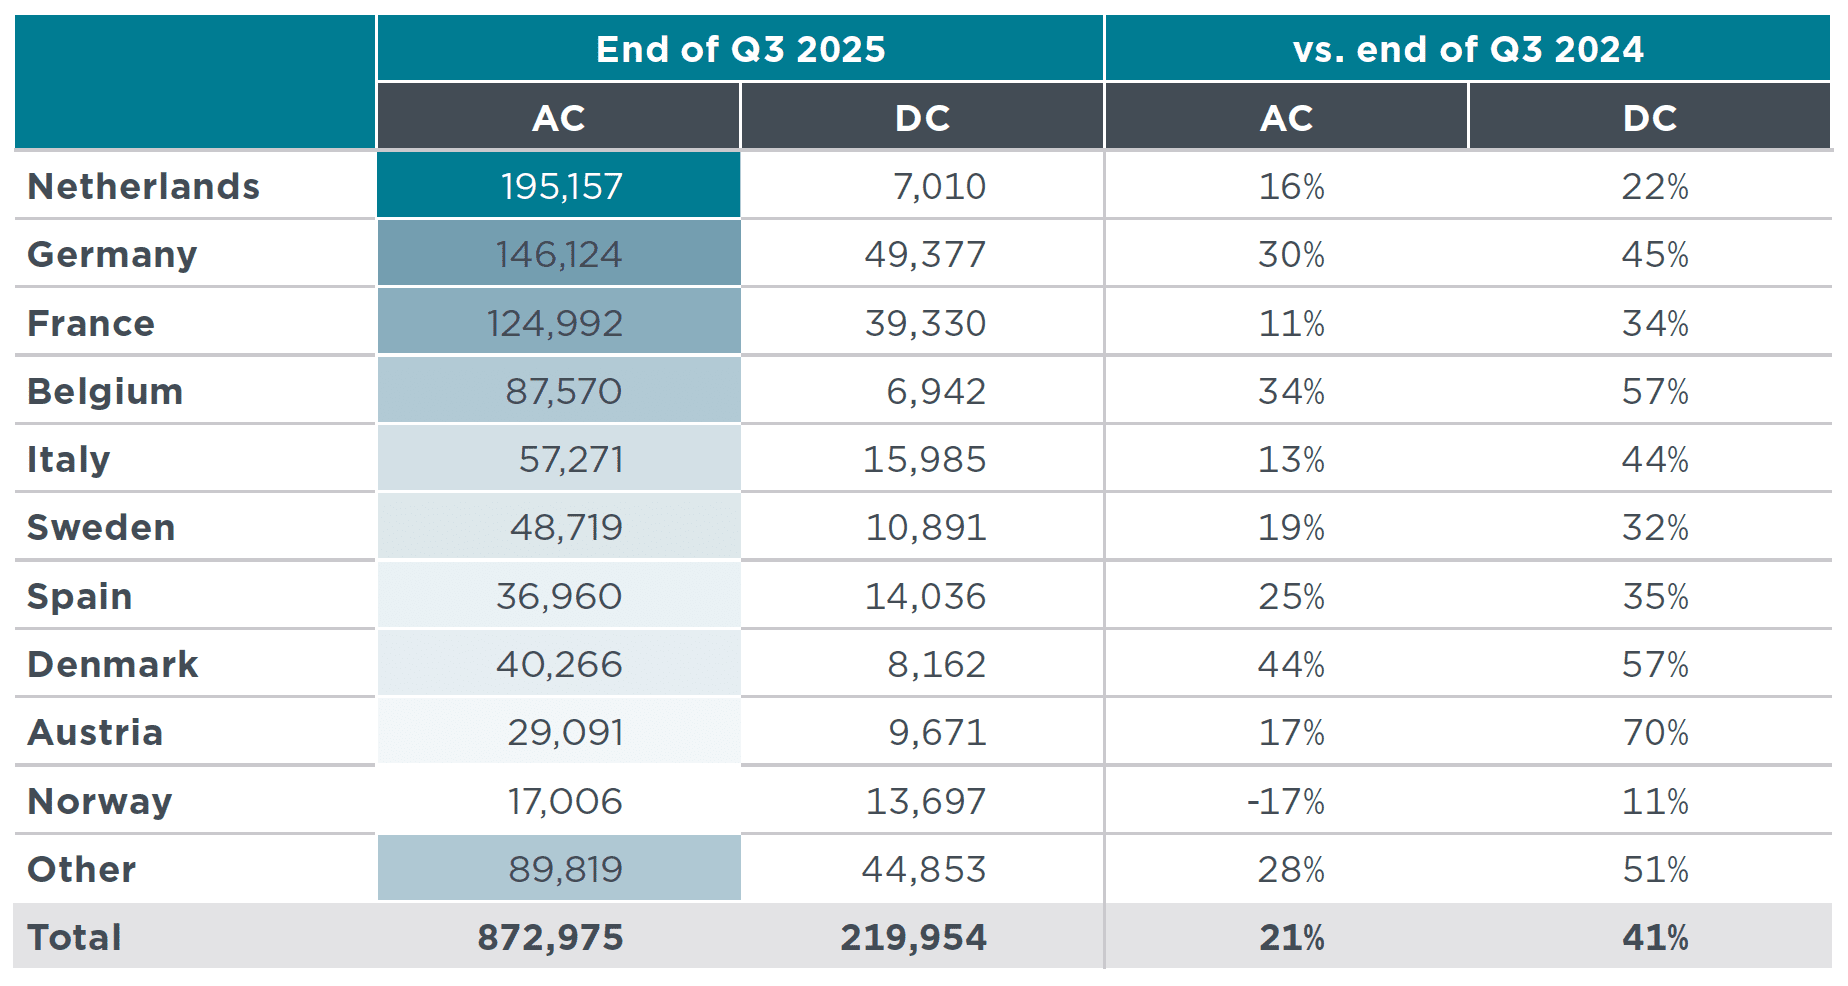
Public charging infrastructure is being deployed faster than the rate of EV adoption in Europe. Over 1.09 million public charging points were installed in Europe by the end of Q3 2025, up from around 1.05 million at the end of Q2. For alternating current (AC) charging, this represents a 21% increase over the same point in 2024. Direct current (DC) charging points showed even greater growth, increasing 41% compared with the end of Q3 2024. Approximately 80% of Europe’s public charging points supply AC, while the remaining 20% supply DC. Denmark recorded the largest growth in AC chargers by the end of Q3 2025 compared with end of Q3 2024 (+44%), while DC charging points increased the most in Austria (+70%), followed by Belgium and Denmark (both +57%). There were on average roughly 8.2 22-kW-equivalent publicly accessible charging points installed per thousand passenger cars and vans on the road in Europe at the end of September 2025, up from 7.5 at the end of June. With over 50 22-kW-equivalent publicly accessible charging points per thousand passenger cars and vans, Norway continues to lead Europe in charging infrastructure, followed by Iceland (43), Denmark (36) and Sweden (26). Italy (3) and Spain (3) fell below the European average for publicly accessible charging points.
Figure 5. 22 kW-equivalent publicly accessible charging points installed per thousand passenger cars and vans, by type of power output and country by the end of September 2025
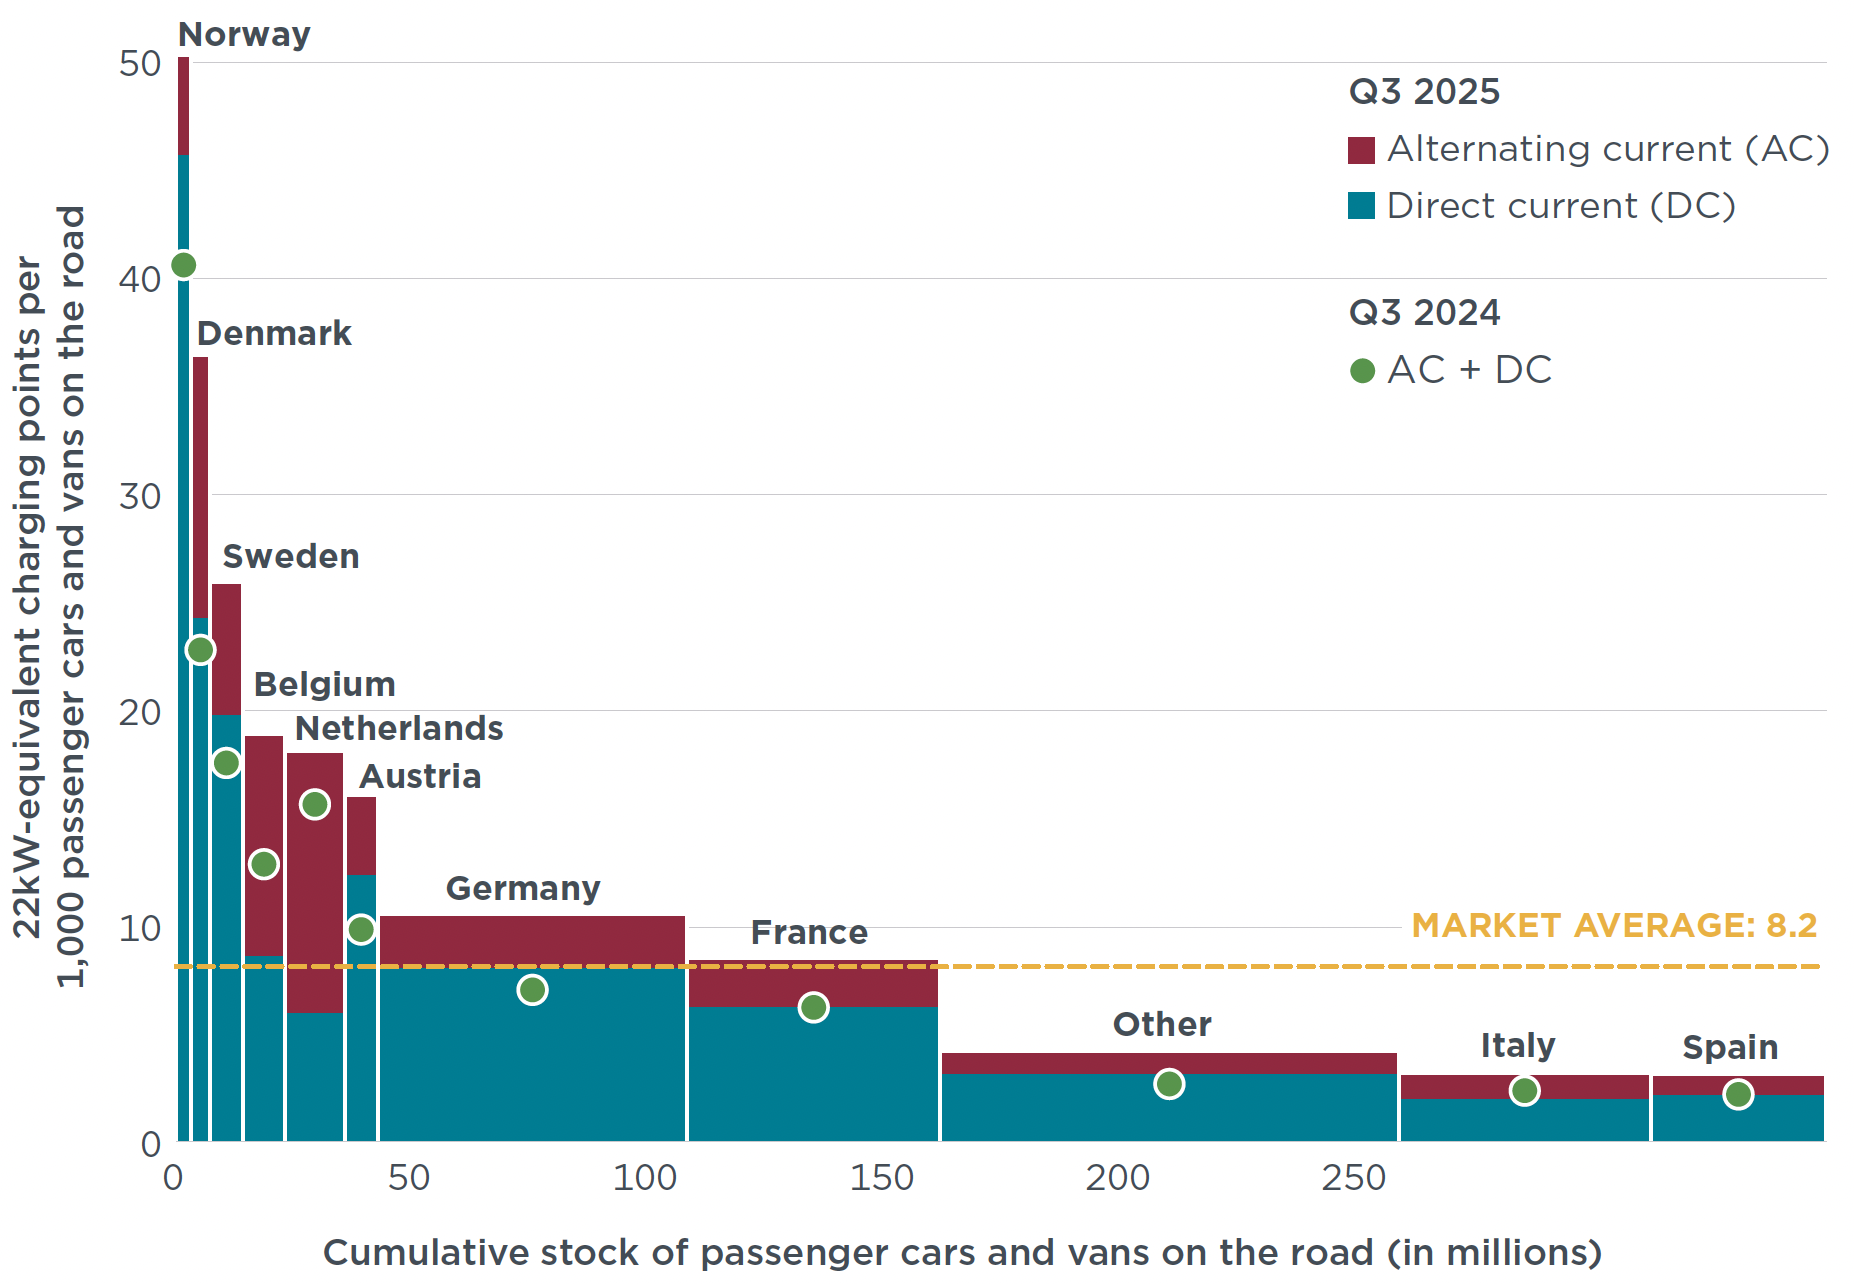
Table 11. Number of publicly accessible charging points installed, by country and type of power output
Definitions, data sources, methodology, and assumptions
-
Manufacturer pools: Automakers are allowed to form pools to jointly comply with CO2 targets. For this publication, the 2025 pools are defined according to the European Commission’s “M1 pooling list” (cars), version of 15 September 2025, as well as the “Declaration of intent to form Open Pools” (cars), version of 17 October 2025, and the “N1 pooling list” (vans), version of 21 August 2025. The 2024 closed pools from these lists have been carried over into 2025, even in the absence of a 2025 formal declaration, as they typically remain stable due to ongoing commercial affiliations (e.g., the BMW, Hyundai, and Kia pools). In contrast, only open pools that have been confirmed for 2025 are included, as their composition tends to change more frequently than closed pools. Additionally, it is assumed that the Renault Group forms closed passenger car and van pools in 2025 with its affiliated manufacturers, and that the Mercedes-Benz Group forms a closed van pool with its affiliated manufacturers. For cars, the main brands are: BMW pool (BMW, Mini), Hyundai pool (Hyundai), Kia pool (Kia), Mercedes-Volvo-Polestar-Smart pool (Mercedes- Benz, Polestar, Smart, Volvo), Nissan pool (BYD, Nissan), Renault pool (Dacia, Renault), Tesla pool (Citroën, Fiat, Ford, Jeep, Mazda, Opel, Peugeot, Suzuki, Tesla, Toyota), Volkswagen pool (Audi, Cupra, Porsche, SEAT, Škoda, VW). For vans, the main brands are: Ford pool (Ford), Mercedes-Benz pool (Mercedes-Benz, Mitsubishi Fuso), Renault pool (Renault), Stellantis pool (Citroën, Fiat, Opel, Peugeot), Toyota pool (Toyota), Volkswagen pool (MAN, Volkswagen). SAIC is a large passenger car manufacturer not part of a pool. Similarly, Iveco and Nissan are large van manufacturers not part of a pool.
-
Abbreviations: AC = alternating current; CO2 = carbon dioxide emissions; DC = direct current; g/km = grams per kilometer; YTD = year-to-date; ZLEV = zero- and low-emission vehicle.
-
Technical scope: This publication focuses on new passenger car and van registrations. Battery electric vehicles (BEVs) are powered exclusively by an electric motor, with no additional source of propulsion. Plug-in hybrid electric vehicles (PHEVs) combine a conventional combustion engine with an electric propulsion system that can be recharged via an external power source. Hybrid electric vehicles here include full hybrid electric vehicles (HEVs) and mild hybrid electric vehicles (MHEVs). HEVs and MHEVs integrate two propulsion systems, usually a combustion engine and an electric propulsion system that cannot be recharged via an external power source. Key differences between HEVs and MHEVs are the system voltage and system power. This enables HEVs to drive partially pure electric, while the electric propulsion system of MHEVs is typically only capable of assisting the combustion engine. For more on HEVs and MHEVs see: Jan Dornoff et al., Mild-Hybrid Vehicles: A Near Term Technology Trend for CO2 Emissions Reduction (International Council on Clean Transportation, 2022), https://theicct.org/publication/mild-hybrid-emissions-jul22/
-
Geographic scope: The European CO2 regulation for vehicle manufacturers applies to all countries of the European Economic Area (EEA). This includes the 27 Member States of the European Union plus Iceland, Liechtenstein, and Norway. Data for new car and van registrations and shares of electric vehicles in this publication cover all of these countries, with the exception of Liechtenstein and Malta. Data for CO2 emission levels additionally omits Bulgaria, Hungary, Romania, and Slovenia.
-
Data sources: Dataforce (new vehicle registrations), Eco-Movement (charging points), European Environment Agency (vehicle mass and eco-innovation credits). Historical values are regularly updated to reflect all latest data available.
-
Results may change over time: Registrations and/or CO2 data may be retrospectively updated by some of the national type-approval authorities. Similarly, charging infrastructure data may also be retrospectively updated by Eco-Movement.
-
Test procedures: CO2 values are provided according to the Worldwide harmonized Light vehicles Test Procedure (WLTP).
-
Flexible compliance mechanisms: To facilitate meeting their CO2 targets, manufacturers can make use of a number of compliance mechanisms: (1) Manufacturers can reduce their CO2 level by up to 6 g/km by deploying eco-innovation technologies. As a conservative estimate, we apply the 2024 level of eco-innovation CO2 emission reductions per brand. For more on the methodology used, see: Uwe Tietge, Peter Mock, and Jan Dornoff, Overview and Evaluation of Eco-Innovations in European Passenger Car CO2 Standards (International Council on Clean Transportation, 2018), https://theicct.org/publications/eco-innovations-european-passenger-car-co2-standards; (2) If a manufacturer’s ZLEV share exceeds 25% (cars) or 17% (vans), its CO2 target is increased by the same number of percentage points, up to a maximum of 5%. This adjustment is referred to as the ZLEV factor, while the target before adjustment is called the manufacturer reference target. The manufacturer target is calculated by multiplying the reference target by the ZLEV factor. ZLEVs are BEVs and vehicles with CO2 emissions of 50 g/km (WLTP) or less. For details on the ZLEV factor mechanism, see: Jan Dornoff, CO2 emission standards for new passenger cars and vans in the European Union (International Council on Clean Transportation, 2023), https://theicct.org/ publication/eu-co2-standards-cars-vans-may23/.
- Mass-based targets: For each manufacturer or manufacturer pool, a specific 2025 CO2 target value applies, depending on the average WLTP test mass of the new vehicles registered. For this publication, we assume the average WLTP test mass per manufacturer pool remains the same as in 2024; the average 2024 BEV and non-BEV test mass for each manufacturer was calculated based on EEA data and then weighted according to their year-to-date 2025 BEV market shares. For more on the methodology used, see: Uwe Tietge, Jan Dornoff, and Peter Mock, CO2 Emissions From New Passenger Cars in Europe: Car Manufacturers’ Performance in 2023 (International Council Clean Transportation, 2024), https://theicct.org/publication/co2-emissions-new-pv-europe-car-manufacturers-performance-2023-sept24/.
- 2025–2027 averaging: Rather than being required to meet the CO2 target applying from 2025 onwards in each individual year, manufacturers are granted the flexibility to comply based on their average CO2 emissions over the three-year period 2025–2027. This means that manufacturers may exceed their CO2 targets in one or more years, provided that any excess emissions are balanced out by equivalent over-compliance in other years within the averaging period. For more details on the provision, see ICCT, “Public comments on the European Commission proposal to introduce a 3-year “averaging” provision for the CO2 standards regulation for new cars and vans” (International Council on Clean Transportation, 2025), https://theicct.org/wp-content/uploads/2025/03/PublicComments-Averaging-final-27March.pdf.
-
Charging point: As defined in the Alternative Fuels Infrastructure Regulation, a charging point “means a fixed or mobile interface that allows for the transfer of electricity to an electric vehicle, which, whilst it may have one or several connectors to accommodate different connector types, is capable of recharging only one electric vehicle at a time, and excludes devices with a power output less than or equal to 3.7 kW the primary purpose of which is not recharging electric vehicles.”
-
Owner types: This publication considers four types of owners: private cars, company fleets, short-term rentals, and car dealers and manufacturers. The private car category includes all registrations under private individuals, including those of self-employed persons, provided the vehicles are not registered under a company name. Private leasing is also included. Company fleets encompass all vehicles registered to companies, excluding those intended for resale or rental. This category includes company and public administration fleets, commercial long-term rentals, commercial leases, taxis, driving schools, diplomats, etc. The size of the fleet and the extent to which the vehicles are used privately are not considered relevant. The short-term rentals type covers all registrations under large or small national and local rental companies. It also covers all vehicles flagged by authorities as being used for self-drive rental purposes. The car dealers and manufacturers type includes all vehicles registered by car dealers and manufacturers. For automakers, this includes vehicles used for press purposes as well as those for their employees. New registrations data by owner type is aggregated for the following 19 European countries: Austria, Belgium, Czechia, Denmark, Finland, France, Germany, Iceland, Italy, Latvia, Lithuania, the Netherlands, Norway, Poland, Portugal, Spain, Sweden, Switzerland, and United Kingdom.

This publication is a collaboration between the ICCT, IMT-IDDRI, and ECCO think tank.