Evaluating air carrier fuel efficiency and CO2 emissions in the U.S. airline industry
Report
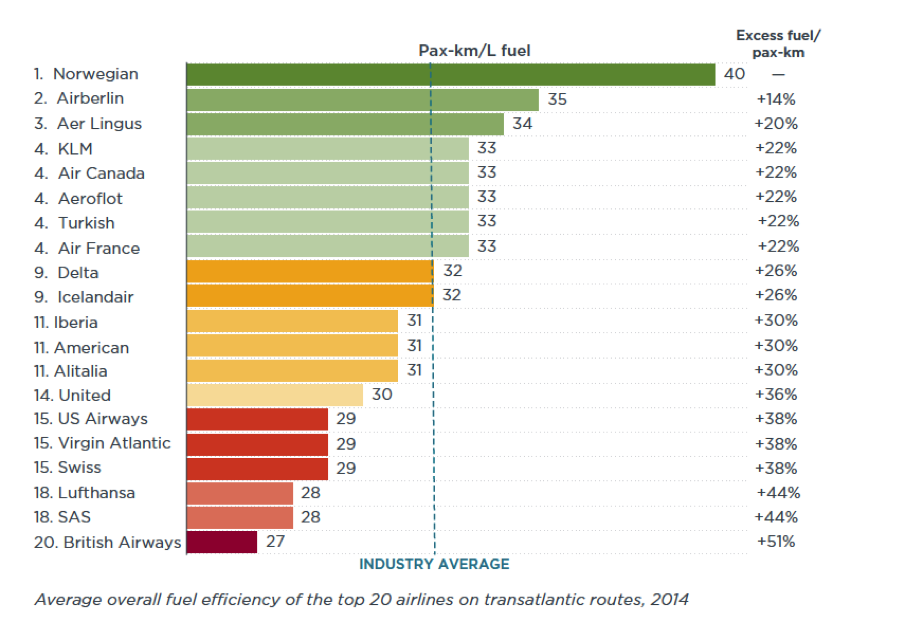
Transatlantic airline fuel efficiency ranking, 2014
This report compares the fuel efficiency, and therefore carbon intensity, of the top 20 airlines on transatlantic routes between North America and Europe in 2014. It is the first analysis to combine the highest quality publicly available and commercial operations data with sophisticated aircraft fuel burn modeling to benchmark the fuel efficiency of carriers on a passenger kilometer basis. The study explains the fuel efficiencies of individual carriers and highlights the most important drivers of efficiency in the aggregate.
Highlights
- The fuel efficiency gap between the most and least fuel-efficient airlines on 2014 transatlantic operations was 51%. That is roughly twice the performance gap between the best and worst U.S. airlines on domestic operations (25% in 2014).
- The three least-efficient airlines (Lufthansa, SAS, and British Airways) were collectively responsible for one-fifth of transatlantic available seat kilometers and burned 44-51% more fuel per passenger kilometer than the most efficient, Norwegian Air Shuttle.
- A nonstop round-trip transatlantic flight averaged about one tonne of CO2 emissions per passenger, equivalent to emissions from a 35-km daily commute in a Toyota Prius over a work year.
- Seating configuration and aircraft fuel burn (i.e., fuel economy of the aircraft operated) are the two most important factors influencing airline fuel efficiency; together they explain about 80% of the variation in fuel efficiency among the airlines studied.
- Passenger load factor (i.e., percentage of seats filled) and freight carriage are relatively less important drivers of fuel efficiency.
- Airlines that have invested in new, advanced aircraft (e.g., Norwegian Air Shuttle) are significantly more fuel-efficient than airlines flying older planes, highlighting the crucial role of technology (and thus performance standards) in driving down fuel consumption and associated carbon emissions.
- The impact of premium seating on emissions is substantial: first class and business seats accounted for only 14% of available seat kilometers flown on transatlantic routes but approximately one-third of total carbon emissions. For carriers like British Airways and Swiss, premium seating was responsible for almost one-half of their total emissions from passenger travel.
Attachments
ICCT_TAranking2014_PressRelease.pdf
ICCT_2014_TA-airline-ranking_factsheet_0.pdf
ICCT_2014_TA-airline-ranking_factsheet_DE.pdf
ICCT_2014_TA-airline-ranking_factsheet_ES2.pdf
ICCT_2014_TA-airline-ranking_factsheet_FR.pdf