Blog
Some upcoming changes in the ICCT global passenger vehicle GHG standard comparison charts
In coming weeks we’re going to be making some tweaks to our chart series comparing passenger vehicle fuel economy and greenhouse gas emissions standards worldwide. Since these charts are consistently among our most-requested resources, we thought we’d give a heads-up.
The goal of our Global PV Standards project is to fairly compare the stringency of vehicle standards and the levels of PV fleet fuel consumption and GHG emissions across major markets that regulate those things. What makes that a less than perfectly simple and straightforward comparison are the differences in fleet categorization and test cycle specifications among countries. Overall, the Global Standards project accounts for those differences on a running basis, as regulations change; since 2007, we have been updating the comparison as new standards and fleet performance reports come out. The chart series is the key summary of that data and analysis.
The changes we’ll be unveiling, which have been in the works for some time, are aimed at making the comparisons across countries/markets more precisely accurate on several levels. In brief, they will:
- Separate passenger car fleets from light commercial vehicles/light trucks
- Compare tailpipe GHG emission standards without credits for non-tailpipe GHG emissions, such as low-global-warming-potential (GWP) refrigerants
- Apply new conversion factors for the CO2 emission rates between different test cycles
In a little more detail:
Separate passenger car fleets from light commercial vehicles/light trucks
The definition of “light-duty vehicle” varies from market to market, as does composition of the vehicle fleet. For example, the light trucks included for regulatory purposes in the definition of light-duty vehicles in the United States, Canada, and Mexico are mostly categorized as light commercial vehicles in other countries. This is significant for comparing regulations. Light trucks/light commercial vehicles (e.g. pickup trucks, some vans and SUVs) are usually heavier and bigger than passenger cars, and thus their fuel efficiency or GHG emission targets are accordingly less stringent than passenger cars’. Incorporating light trucks into the light-duty vehicle targets for North America, while leaving them out for the rest of the world makes North American passenger car standards weaker than they really are.
However, our original 2007 comparison didn’t characterize the fleet at that level of detail, however, and for consistency we had continued to use that approach. Now, in order to more fairly compare light-duty vehicle standards on an apples-to-apples basis, we’ve revised our database to separately compare passenger vehicle and light commercial vehicles/light trucks. While this is an improvement, note that minor differences among definitions of “passenger car” remain, which we have not attempted to accommodate in this round of revisions. For example, some four-wheel-drive SUVs are counted as light trucks in the US but as passenger cars in other markets.
Excluding the more lenient standards for light trucks makes the passenger car GHG standards in North America more directly comparable to the light-duty vehicle standards in other jurisdictions. This change is already reflected in the charts and data on the ICCT global passenger vehicle standards page. We will soon publish new standard comparison charts for light commercial vehicles for the US, Canada, Mexico, Europe, China, and Japan.
Compare tailpipe GHG emission standards without credits
For historical reasons, US light-duty vehicle efficiency standards are jointly effected by the Environmental Protection Agency, which regulates Greenhouse Gas emissions, and the National Highway Traffic and Safety Administration (NHTSA), which sets Corporate Average Fuel Economy (CAFE) targets. The two agencies issue separate standards. Because they cooperate, the standards are similar; but because they’re different agencies, regulating under different statutes, the standards are not identical.
One of the important differences is that the EPA GHG standard gives manufacturers credit toward compliance for using low-GWP refrigerants in air-conditioning systems, and sets per-vehicle emission caps for nitrous oxide (N2O) and methane (CH4) emissions. As a result, the fuel economy value if manufacturers met EPA standards using only tailpipe CO2 reductions will be higher than if manufacturers made full use of low-GWP refrigerant credit.
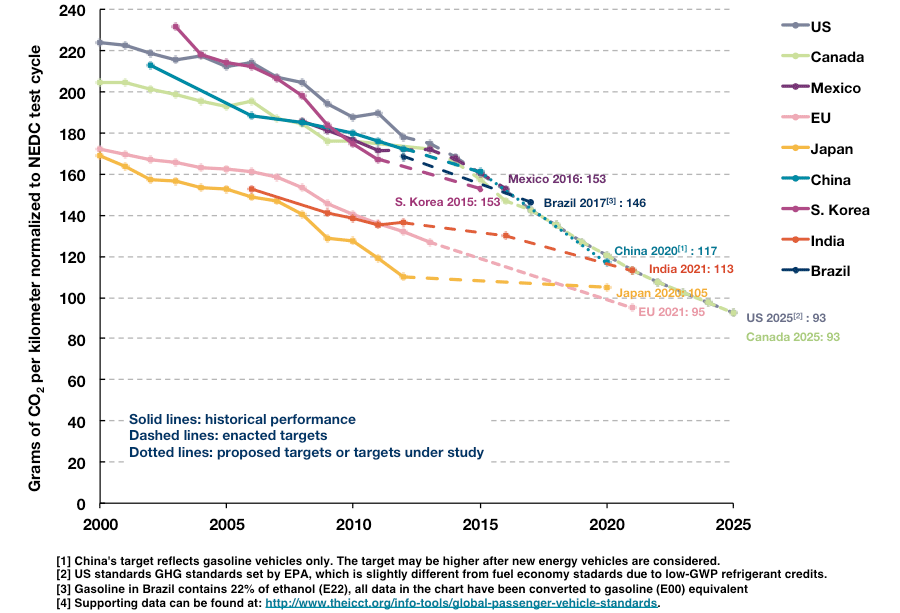
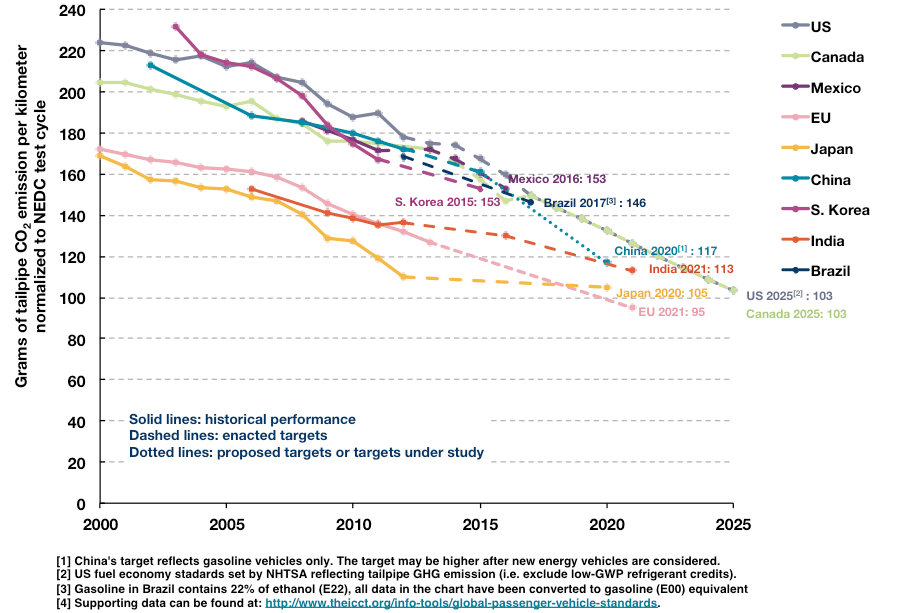
In comparing the U.S. standards (and Canada’s, which follow the same pattern) to other global standards, we have been using EPA standards for GHG comparison charts and NHTSA standards for fuel consumption. We will be changing that approach in favor of a direct comparison of tailpipe GHG emission requirements. In other words, we will derive the GHG equivalent from NHTSA’s CAFE standard to reflect the US GHG standards; the GHG emission reduction realized by using low-GWP refrigerants will be excluded from the comparison.
A consequence of this change will be to show the US and Canada tailpipe CO2 standards, especially the 2025 standards, as somewhat less competitive relative to the standards in other markets. The two charts below illustrate the differences in the US and Canada GHG standards before and after the switch (using existing conversion factors). Though Mexico is following the same standards design as the US and Canada, its GHG emission standards do not provide credits to low-GWP refrigerants; therefore is not impacted by the change.
Apply new conversion factors
The conversion factors are used to correct CO2 emissions or fuel economy for differences in test-cycle specifications [pdf], such as driving dynamics, averaged vehicle speed, idle time, and starting conditions. The methodology used for current global PV GHG standards comparison was developed in our initial 2007 report, based on a limited set of gasoline-only vehicle models with a technology time horizon reaching to 2015. But vehicle technologies have dramatically changed, and the old conversion factors no longer properly reflect CO2 emission correlation across different test cycles.
The new conversion factors will update the gCO2/km based algorithms used to convert results among U.S. CAFE driving cycle (combining FTP75 and Highway Fuel Economy Test cycle), the New European Drive Cycle (NEDC), Japan’s JC08 driving cycle, and the World-Harmonized Light-Duty Vehicle Test Cycle (WLTC) that many regions, including the EU, Japan, China, and India, plan to adopt in the future.
The new methodology relies on conversion factors generated using more sophisticated simulation models, both current vehicle and longer-term projections, and a large variety of innovative technologies. As many of the new vehicle technologies (e.g., start/stop) focus on improving engine efficiency at low load, standards using test cycles with longer idle time (i.e., NEDC and JC08) will not be as stringent relative to the US CAFE as they were using the old conversion factors.
These changes are designed to improve the accuracy and fairness of the comparison of fuel economy and GHG standards among different markets. They’ll be reflected on our website page (www.theicct.org/info-tools/global-passenger-vehicle-standards) and in a new summary report on global passenger vehicle fuel economy and GHG policy, due out shortly to update the original 2007 study. Stay tuned.