Analyzing policies to grow the electric vehicle market in European cities
Blog
Whose BEV is it anyway? New registrations and disparities across Europe
Demand for battery electric vehicles (BEVs) significantly increased in Europe between 2020 and 2021. New BEV registrations in the passenger car segment grew by 70% from almost 578,000 to over 981,000 among 21 European markets. These numbers are promising as national governments continue to work towards decarbonizing the transportation sector. Looking at who is buying BEVs, over half were purchased by private individuals—54% in 2020 and 57% in 2021. The remaining registrations of BEVs belonged to the true fleets market, which includes company cars, long-term rentals, leased vehicles, taxis, and cars belonging to driving schools, public administrations, and diplomats. New registrations of manufacturers, dealerships, and rental companies are not considered here.
There are considerable differences in the 21 European countries for which private and true fleet data is available. The interactive maps below visualize the share of private individuals in the total new BEV registrations (private plus true fleets) for the first and second half of 2021. The Czech Republic had the lowest private BEV share in the first half of 2021 with 13%. In the second half of 2021, Belgium had the lowest share with 14%. Hence, in both countries, the true fleet market dominated new BEV registrations. On the other side of the spectrum, Cyprus had the highest private BEV registration shares at 94% in 2021 while BEVs in true fleet registrations played a minor role.
Figure 1. Share of BEV registrations by private individuals in total new BEV registrations (private and true fleets) in the first and second half of 2021 for 21 European countries (Source: Dataforce).
Bear in mind that when looking at the shares, they are not necessarily fully conclusive in some cases. As shown in Figure 2, in countries such as Cyprus, Lithuania, Latvia, Slovakia, and the Czech Republic, total new registrations of BEVs were less than 1,500 throughout 2021, meaning the purchase behavior of one company could reduce the private share. Yet, for most of the countries displayed, the volume is such that a single company would not have a significant impact on the BEV share breakdown.
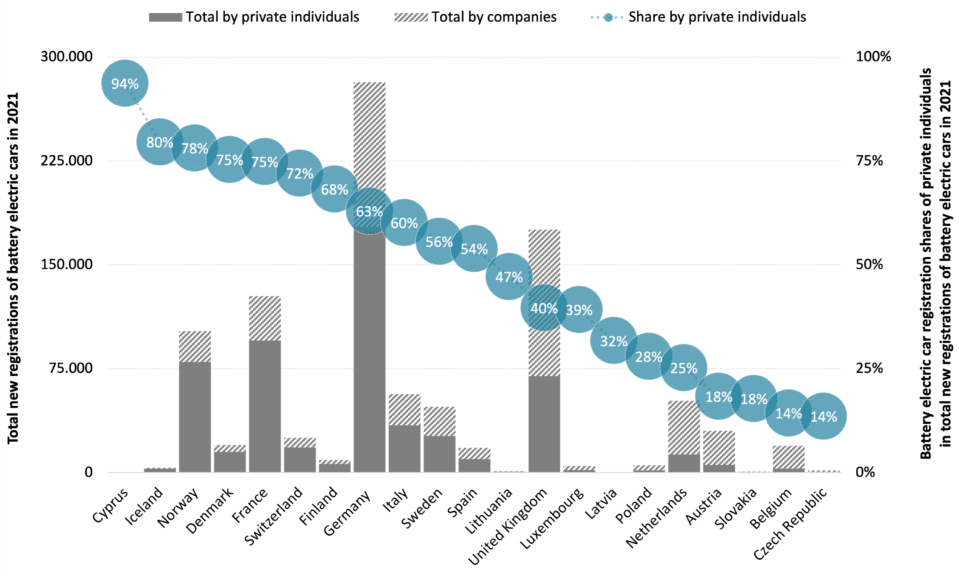
Figure 2. Total new BEV registrations by private individuals and companies and share of BEV registrations by private individuals in total new BEV registrations (private and true fleets) in 2021 for 21 European countries (Source: Dataforce).
In countries such as Belgium, Austria, and the Netherlands, the true fleet market dominates new BEV registrations, accounting for three quarters or more in 2021. As vehicles in these fleets typically have higher annual mileages than privately owned cars, the substitution of combustion engine vehicles in the true fleet sector can be a major lever for reducing transport emissions and achieving climate protection goals. Fleets also have a faster ownership turnover rate than private cars, thus accelerating the increase of BEVs available in the used vehicle market to the benefit of a larger consumer group who currently cannot afford a new BEV. Some of the vehicles in the true fleet segment are also provided for the private use of an employee, which is considered a benefit in kind and is taxed via the income tax. Why highlight this? Because the taxation of the benefit in kind of using a company car for private purposes is typically much lower than the overall taxation would be if an employee is paid a higher salary to buy and own the same car themself. This so-called company car privilege has a regressive effect from a social standpoint as the share of people having a company car for private usage is higher in higher income groups.
On the other side, the share of private BEV registrations is particularly high in countries such as Norway, Denmark, France, and Switzerland. Here, seven out of ten BEVs were newly registered by a private individual in 2021. So, who is buying these cars when looking at income groups? Taking Norway as an example, the world’s most advanced BEV market with 54% of new passenger car registrations in 2020 (and 65% in 2021). The figure below shows the share of battery electric cars in total private new passenger car registrations and the total BEV and non-BEV registrations across ten income groups in 2020. Of total newly registered cars, 63% were BEVs among the 10% of households with the highest annual household income (above €182,500). While the BEV shares decrease for lower income groups, the 10% of households with the lowest income (below €27,200), still opted for a BEV at a rate of 58%. This comparably high share might be partially explained by the countries’ long history of significant tax incentives for BEVs and a greater model availability across vehicle segments. Yet, new cars including BEVs are typically bought by wealthier individuals, as the totals reveal. While almost 12,700 new BEVs were bought by private individuals in the highest income group in 2020, it was 28 times less in the lowest income group. Consequently, high income groups in Norway benefit most from tax advantages when buying a new BEV, including the waiver of the 25% value added tax based on the vehicles base price and a registration tax exemption, which in turn results in a distorted distribution effect of these benefits.
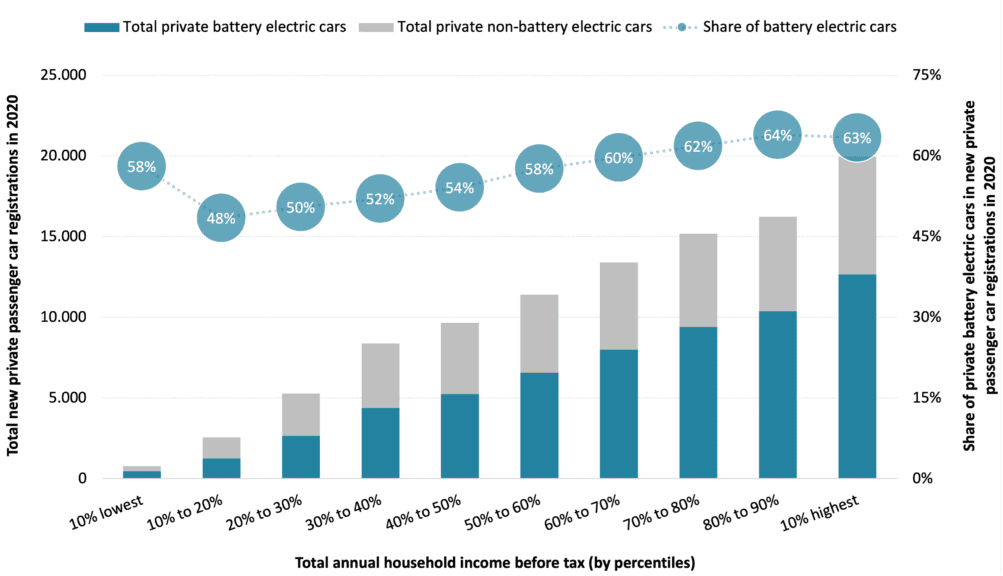
Figure 3. Total new private passenger car registrations in Norway in 2020 and private share of BEVs (Source: Statistics Norway).
From a policy perspective, as indicated above, income-agnostic purchase subsidies and tax benefits for BEVs have a regressive effect, as higher-income households receive the largest share of the benefits. But how can this be addressed? Let’s look at a few examples of programs for private BEV purchases. Outside of Europe, the California Clean Vehicle Rebate Project gives low-income households an additional $2,500 (€2,300) on top of the regular rebate for a new BEV or plug-in hybrid. Since its inception in 2016, 34% of the funding, or $182.9 million (€163 million), went to lower-income applicants and private individuals living in disadvantaged communities, rising to a share of 38% in 2020. Other incentive programs which consider a household’s annual gross income include California’s Clean Vehicle Assistance Program, Oregon’s Clean Vehicle Rebate Program, and Pennsylvania’s Alternative Fuel Vehicle Rebate Program. In Europe, France offers an income-based bonus for the scrappage of an old vehicle in favor of a zero- or low-emission vehicle.
At the same time, countries such as Germany and the United Kingdom have increased the benefits for the private use of a battery electric company car. While from an environmental perspective this policy might help spur BEV adoption, it does not reduce the regressive social effects. To counteract this, governments could consider reducing the company car privilege by increasing the company car tax rate in the income tax or abolishing it altogether. Yet, most countries in Europe offer this form of benefit in kind. Supporting alternative modes of transportation rather than a company car, such as the mobility budgets adopted in Belgium, still benefits those high-income groups who are entitled to it.
So, whose BEV is it, then? In 21 European countries, private individuals are in the lead in new BEV registrations with a share of 57% while true fleets account for 43%, at least in 2021. By income, it is typically the wealthier households who are able to afford a new car or benefit from a company car. Therefore, wealthier individuals are benefiting the most from the subsidies and tax advantages offered by national governments. To address social imbalances and inequities, policies should be made with financial disparities in mind so that no groups are left behind in the transition to BEVs.