Blog
Not every tonne of aviation CO2 is created equal
As concerns about climate change lead countries, companies, and individuals to increasingly track and manage their greenhouse gas emissions, the issue of how to responsibly apportion global aviation emissions remains tricky. While the International Civil Aviation Organization (ICAO) assigns international emissions to the country in which an airline is incorporated, the ICCT recently analyzed commercial aviation CO2 emissions in 2018 and allocated them by country of departure. Our study identified the United States, China, the United Kingdom, Japan, and Germany as the five largest CO2 emitters from passenger flights in 2018.
Another measure, per capita jet fuel use and CO2 emissions, tells the story from another angle. My colleague, Dan Rutherford, previously estimated per capita fuel use for a few major economies using the U.S. Energy Information Agency’s jet fuel use statistics, which were adjusted for asymmetric tourism flows using World Bank data. Specifically, we applied the outbound-to-inbound tourist ratio to the emissions from international flights; this adjustment distinguishes between residents of a country traveling abroad and foreign visitors traveling to that country on the same flight. The results showed that in 2016, the average U.S. citizen emitted about five times more aviation CO2 than the global average.
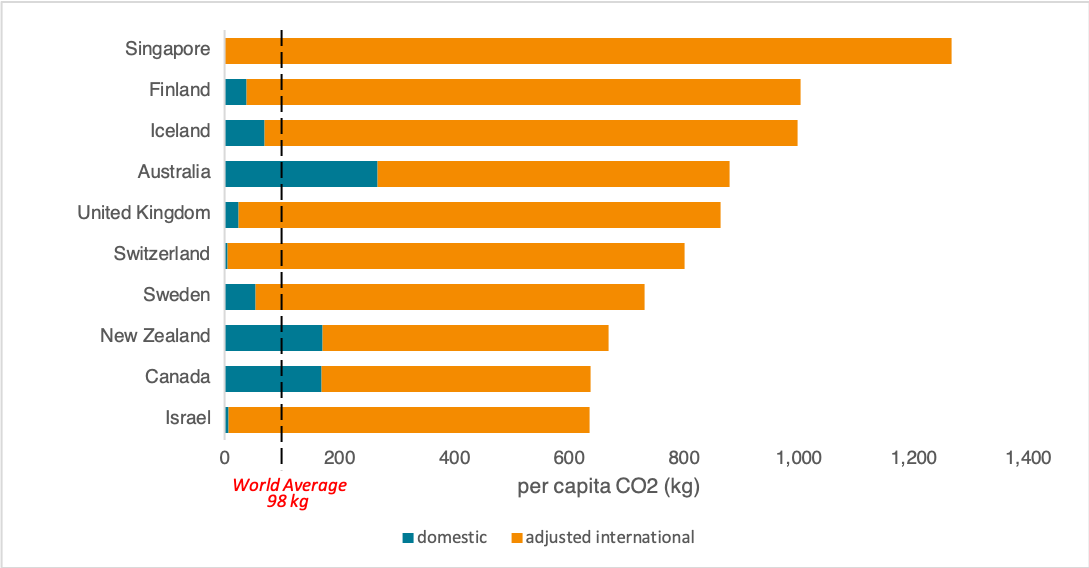
Now that the ICCT has compiled global data for 2018, it is possible to identify the top emitters that year in terms of adjusted per capita CO2 emissions. The results are shown in the figure below. After adjusting for the above-described tourism and hub effects, we see that the average Singaporean generated more than 1.2 tonnes of aviation CO2 emissions in 2018—12 times the global average. Finland and Iceland were second and third, respectively, emitting around 1 tonne of CO2 per capita. Swedes, who started the flygskam (“flying shame”) movement, emitted the seventh largest amount of aviation CO2 on a per capita basis in 2018. A country’s level of economic development undeniably plays a role here, as in each of these countries, a larger-than-average portion of the population has enough money to fly.
Another lens through which to view per capita emissions is to look at unadjusted figures and consider which countries have highly tourism-dependent economies. The table below presents the per capita CO2 emissions of countries with the highest inbound versus outbound traveler ratio and also a greater than 0.05% share of total global revenue passenger kilometers (RPK) in 2018. As expected, all 10 countries are popular tourist destinations. Additionally, a few of them—the UAE, Spain, and Turkey—are also major aviation hubs.
| Country | Ratio of inbound over outbound tourists* | Unadjusted per capita CO2 emissions (kg) | Adjusted per capita CO2 emissions (kg) | Average stage length of international departures (km) |
|---|---|---|---|---|
| Dominican Republic | 11.9 | 154 | 13 | 3,514 |
| Croatia | 8.1 | 139 | 24 | 1,282 |
| Portugal | 7.0 | 429 | 98 | 2,381 |
| United Arab Emirates | 6.3 | 2,195 | 350 | 3,499 |
| Morocco | 6.1 | 57 | 11 | 2,399 |
| Fiji | 5.0 | 438 | 130 | 3,239 |
| Spain | 4.8 | 396 | 131 | 2,357 |
| Mauritius | 4.7 | 609 | 135 | 4,994 |
| Turkey | 4.2 | 145 | 67 | 2,173 |
| Thailand | 4.0 | 188 | 75 | 3,414 |
| World average | 1.0 | 98 | 98 | – |
*Calculated from World Bank data, which are available for 61 out of the 88 countries with >0.05% share of global RPK
As the table shows, the average person in the Dominican Republic emitted 13 kg of aviation CO2 in 2018, in contrast to the world average of 98 kg per capita. This indicates little flying by local people, but the per capita number is 11 times higher before adjusting for tourism and hub effects. Two other small island developing states (SIDS), Fiji and Mauritius, also received a large number of foreign tourists by air. These countries’ economies have all benefited from international aviation, especially from medium- and long-haul flights. The effect of disrupted aviation operations on small island territories and states can be significant, as seen recently after the Thomas Cook collapse. Meanwhile, these states are quite vulnerable to climate change impacts, and SIDS have consequently been calling for deeper and faster decarbonization. Therefore, reducing aviation demand might be a double-edged sword for certain countries.
Flying less would mean different things for different people, and this adds another layer to the equity implications of reducing aviation emissions. For the average Singaporean, flying less likely means a modest change in lifestyle by reducing the number of business and leisure trips in a year. Meanwhile, fewer flights to the Dominican Republic might put local people in the tourism industry out of work. Thus, for the same amount of climate mitigation benefit, who flies less, and for what purposes, will lead to different socioeconomic outcomes.
Nevertheless, since the majority of flights to tourism-dependent destinations are medium- or long-haul, we could reduce or avoid short-haul flights under 1,500 km without overly impacting these economies. Notably, short-haul flights collectively made up one-third of global aviation emissions in 2018. Indeed, travelers in Sweden have already started choosing rail over air due to concern for climate change. Policymakers could also design policies that incentivize modal shift by discouraging short-haul flights. These policies could include a ticket tax differentiated by the amount of landing and take-off NOx emissions produced by the flight.
Meanwhile, ICAO has tried to address the equity concern by exempting all SIDS, least-developed countries, landlocked developing countries, and the bottom 10% constituents of global traffic from its CO2 offsetting program. The resulting emissions coverage is about three-quarters of total growth in international aviation from 2020 onward. In contrast, the top 20 destinations most reliant on tourism, measured by the percentage of tourism’s contribution to gross domestic product, were only responsible for 0.61% of global passenger aviation emissions in 2018. This suggests room for more targeted exemptions to account for the different levels of economic dependency on international aviation among states.
While physically every tonne of CO2 emissions reduction is the same, the economic and social aspects of flying require us to further deliberate on reducing aviation emissions by lowering demand. From an individual perspective, we can start by taking fewer short-haul flights before making any decisions about whether to cancel an island vacation.