Report
European vehicle market statistics 2022/23
The ICCT’s European Vehicle Market Statistics 2022/23 Pocketbook provides an annual statistical portrait of the state of the EU car, van, truck, and bus markets in their transition to decarbonization. The report includes information from 2001 to 2021 on vehicle sales, fuel economy, greenhouse gases, and other air pollutants. Visit our eupockebook.org website for an easy-to-read navigation of its facts and figures.
This year’s analysis shows a continued decrease in vehicle sales in the EU market and a stagnation of the electric car market in early 2022 after a steep increase in previous years. The EU’s electric passenger car market share of 19% in 2022 was less than China’s share (24%), although it was significantly ahead of the United States (7%).
The average CO2 emissions from new passenger cars in the European Economic Area, according to the Worldwide Harmonized Light Vehicles Test Procedure (WLTP), decreased to 115 g/km in 2021, which is approximately 16 g/km lower than in 2020.
Other select highlights of the 2022/23 edition include:
- Vehicle sales have continued to decrease since the last peak in 2019. The Covid-19 outbreak reversed the growth in sales, which in 2021 continued to decline, 3% less than the previous year and 26% less than the market peak in 2019.
- The electric car market jumped from 3% in 2019 to 19% in 2021, but these sales stagnated in the first months of 2022, partly due to lapsing government subsidies and supply shortages.
- Norway (65%), The Netherlands (20%), and Sweden (19%) are the top markets in the battery electric car segment in the European Economic Area. The big EU vehicle markets are lagging at very different speeds: Germany (14%), France (9%), Italy (5%), and Spain (3%).
- Extensive charging infrastructure partly explains the success story of Norway and The Netherlands in the electric car market. Norway reached 14.5 publicly accessible charging points per thousand passenger vehicles in 2021, over seven times the EU market average, followed by the Netherlands with 8 charging points.
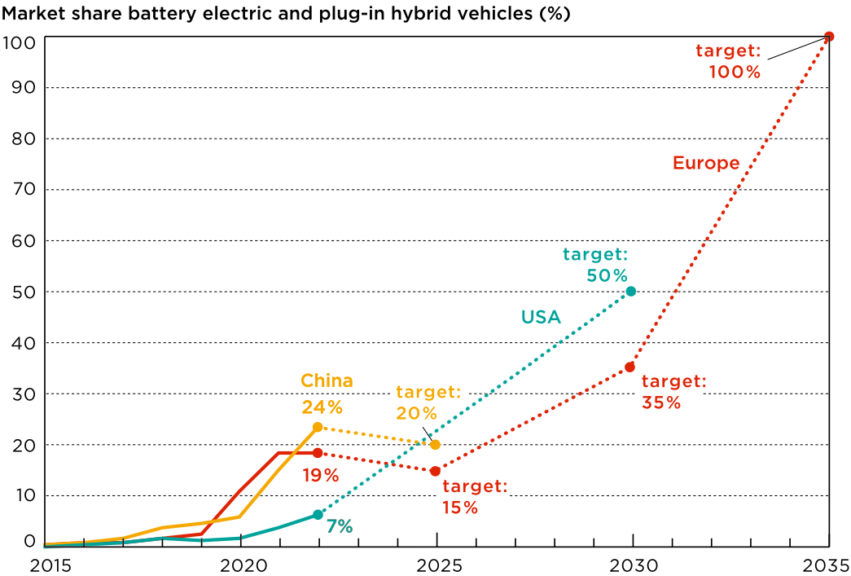
Data for China and the United States is taken from Marklines. Data for Europe is taken from the European Environmental Agency (EEA) and Dataforce. Data for China and Europe only includes passenger cars, while data for the United States also includes light trucks.