Toward an ambitious yet feasible strategy for transport decarbonization in India
Blog
What’s the “business as usual” future for road transport in India?
The second in a blog series focused on our meta-study of India’s road transport emissions analyses.
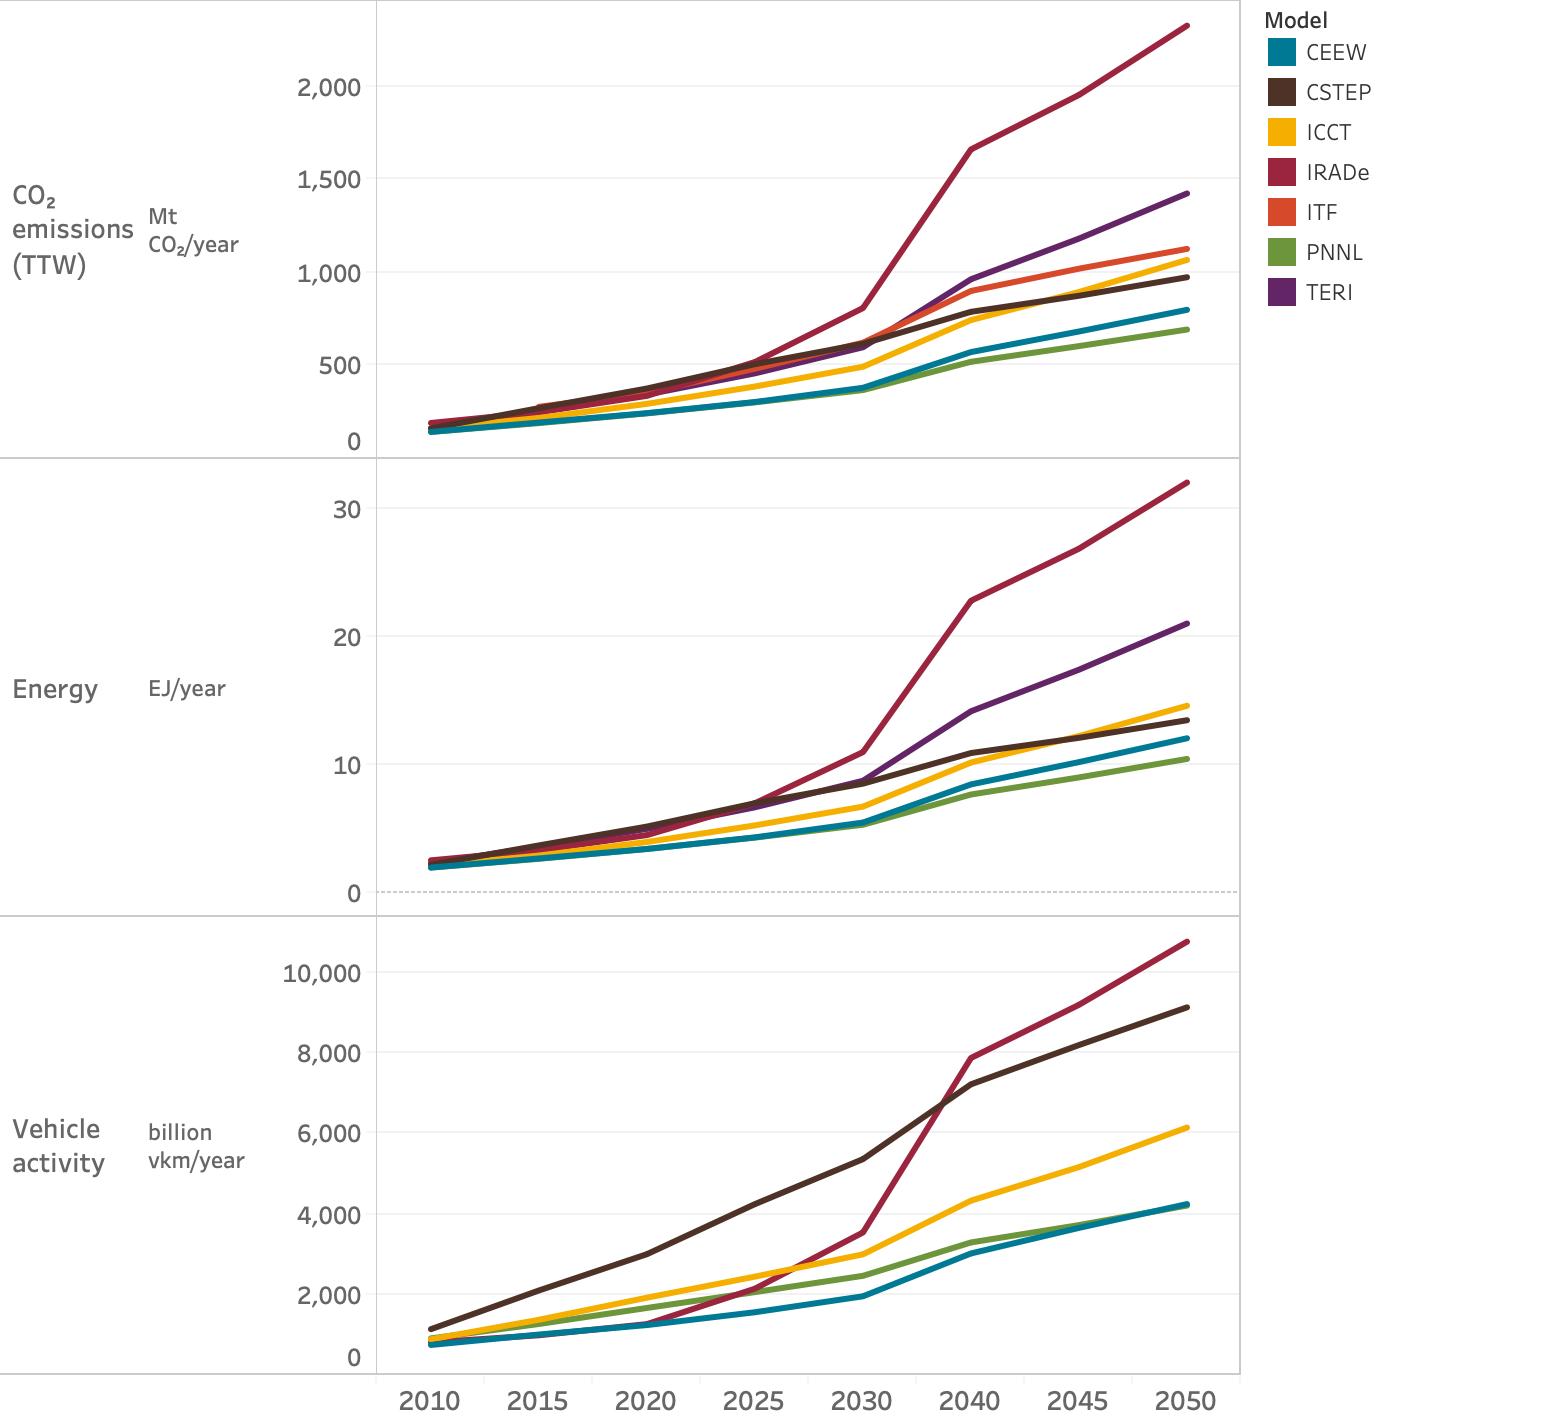
It’s not hard to predict that if India continues as is, it will mean an unabated rise in vehicular activity. Large quantities of fossil fuel will be burned and it will generate massive amounts of CO2 emissions. Indeed, our analysis of the Business as Usual (BAU) scenarios of the models detailed in the first blog, which mostly project energy and CO2 emissions considering only current trends and policies and expecting no further policy action, shows they all paint a grim picture of India’s road transport sector, without contradiction. In one way it’s heartening to see a high degree of coherence in the model forecasts illustrated in Figure 1, as they leave little room for debate about our predicament. But at the same time, it’s terrifying to realize that inaction could lead us into a hazy future, literally.
Here it’s important to acknowledge that while some of the models consider no further policy action under BAU, others incorporate some degree of improvement or account for near-term policies that have been legislated. For instance, no efficiency improvements are considered in IRADe’s BAU scenario, but fairly large efficiency improvements are built in by CEEW and PNNL for all years till 2050. Additionally, in ICCT’s BAU scenario, near-term fuel efficiency improvements as adopted by the Government of India until 2022 are incorporated. There are also variations across BAU scenarios in terms of fuel technology and mode share trends assumed. Some models build in change in these assumptions incrementally, but others keep these assumptions rather static. Despite these variations, we group these scenarios together for the purpose of our BAU analysis largely because all of them exhibit, to varying degrees, a continuing trend of rapid vehicle growth accompanied by high CO2 emissions and energy consumption.
In this context it’s also important to remember that for each year that continues under this BAU without any change in course, these emissions accumulate. And when it comes to climate change mitigation, cumulative emissions matter most and it’s not only where we reach at the end of 2050. Hence, the sooner we start mitigation, the more cost-effective it will be for us to decarbonize.
Let’s consider vehicle activity. Most of the models envisage that it will increase 3–3.5 times between 2020 and 2050, from 1,800 billion vehicle kilometers traveled (vkt) per year on average in 2020 to around 5,000 billion vkt/year in 2050 (bottom section of Figure 1). These average numbers exclude outlier values. Models from CSTEP and IRADe, however, expect much higher vehicle activity, close to 10,000 billion vkt/year in 2050. CSTEP’s high estimates are likely because its gross domestic product (GDP) assumptions are the highest among all the models, across all years. Travel demand is calculated as a function of economic growth, and thus a high GDP assumption leads to a high vehicle activity level.
Additionally, IRADe’s BAU scenario includes an exceptionally high eight-fold increase in vehicle activity between 2020 and 2050 as a result of a massive increase in car use and decline in public transport use. While this type of trend is mostly consistent across models, in IRADe’s model, the shift from buses to cars is extremely pronounced: The share of cars in vehicle activity increases from 28% to 66% over three decades, and the bus share drops from 14% to a mere 2%. The only exception among the models is ICCT’s BAU scenario, which expects the share of buses to grow marginally from 7% to 8% and the car share to remain roughly consistent from 21% to 22% between 2020 and 2050. Compared with the other models, this seems like a rather rosy picture.
Another interesting trend observed is that most models expect vehicle activity from two- and three-wheelers to slow down after 2040. Here, too, the only exception is ICCT, which expects two-wheelers to continue to grow at the same pace between 2040 and 2050 as in the previous decade.
The BAU scenarios point to significant energy consumption. Total energy consumed by the road transport sector and the associated tank-to-wheel (TTW) CO2 emissions could very well quadruple by mid-century. (Note that ICCT’s model includes grid emissions for electric vehicles.) The energy consumption is estimated to be around 3.5–5 exajoules (EJ) per year in 2020, and is expected to grow to 11–13 EJ/year on an average by 2050; in TERI and IRADe’s models, it’s 20–30 EJ/year by 2050. CO2 emissions are estimated to be around 300 million tonnes (Mt) in 2020 and to reach 1,000 Mt by 2050. IRADe, however, projects emissions to be as high as 2,300 Mt/year in 2050, likely because the model doesn’t account for any efficiency improvement. In the case of TERI, which has the second highest emissions among the models, the high energy and emissions can be attributed to its high passenger and freight activity estimates, both of which are the highest in the cohort. As we did not have vehicle activity data for TERI, we compared its passenger kilometer (pkm) and tonne-kilometer (tkm) data with that available for PNNL, CEEW, CSTEP, and IRADe. TERI’s freight activity level is double the value estimated by IRADe, which has the second highest estimate in the group: 17,000 versus 9,000 billion tkm/year in 2050. Meanwhile, CSTEP, IRADe, and ITF’s freight activity projections in tkm are very similar.
In most BAU scenarios, petroleum will continue to remain the primary source of energy for the road transport sector, meeting 90%–98% of energy needs in 2050 (Figure 2). CEEW, PNNL, and ICCT expect slight diversification of energy sources by 2050. But only CNG is expected to play any significant role among the alternate fuel options, and it could be catering to 10%–30% or less of energy needs by 2050. IRADe and PNNL expect the highest penetration of electricity, catering to 1.5% of the road transport energy demand by mid-century.

We observe that while freight transport contributes only 10%–20% to vehicle activity in 2020, its contribution to CO2 emissions is disproportionately high at 40%–50% or more. While the shares of passenger and freight vehicles in sales are expected to remain similar in 2050, freight vehicle activity is expected to grow at a faster rate as compared to passenger activity. We sought to corroborate this conjuncture using vehicle mileage data available to us from IEA’s New Policies Scenario that was not used in our meta-study. Indeed, while the mileage increased from 25,000 to 31,000 km/year for heavy-duty trucks (HDTs), for cars it only grew from 10,400 to 11,800 km/year.
HDTs and cars are currently responsible for almost 60% of total road transport emissions and most of the models expect these modes to remain the leading sources of emissions. In the absence of any intervention, these could increase to over 70% by mid-century. One of the significant departures from this trend is observed in the BAU scenario of ICCT, which expects a reduction in emissions from cars and an increase in HDT emissions by the same amount, confining emissions to 57% of the total road transport emissions in 2050, same as in 2020.
Although these models vary in construct and outcome, they all show an upward trend in vehicle activity. Thus, there is an urgent need to take action to correct this course. If we don’t make significant emission reductions in the short and medium term, we will have to make steep reductions in the long run over a shorter period of time. That will be a lot more challenging and a lot costlier. Good thing, the choice is ours!
This project is part of the International Climate Initiative (IKI). The Federal Ministry for the Environment, Nature Conservation and Nuclear Safety (BMU) supports this initiative on the basis of a decision adopted by the German Bundestag.